Kanban

Weeknotes #03 - Learning, Feedback & Flow

Partner Up

Last week I talked about a new initiative we’re trialling called Partner Up. Partner Up is opportunity for PwC staff below Manager grade to showcase technologies and interact with Senior Staff. Held in one to one (or one to many) sessions, volunteers are encouraged to discuss modern technologies with those who have the ability to create future opportunities for PwC.

For my Partner Up session, I had the pleasure of pairing up with Diana, who works in our IT Consultancy team. Diana had decided to showcase the capabilities of Google Sites, in particular things that could be done using Google Apps Script. 

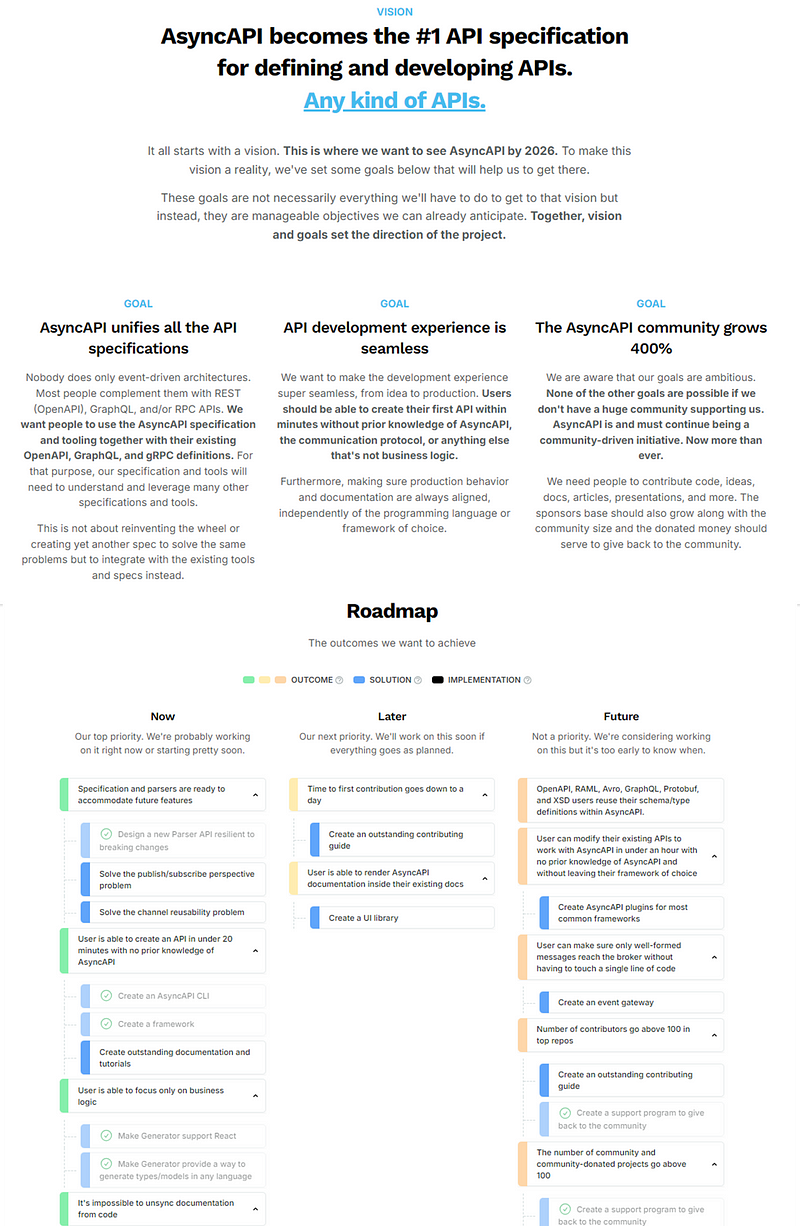
After 45 minutes of learning a hell of a lot, including calendar integration with forms, qualtrics surveys and data visualization embedding within sites, Diana was closing the session in showing me the capability of integrating other tools we use. The highlight being the capability to embed a kanban board within a Google Site, which to me was fantastic!

Agile nerd alert 😍 😍 😍

I started to imagine a world of submitting a request via a Google Form, which then copies into a live Kanban board, where you can see the lead time for your request, where it sits in the queue etc etc…evoking memories of the Phoenix Project and visualising lead times for replacement laptops…always a dream of mine to implement something similar!

Special thank you to Diana, she really went above and beyond what I expected and it was great to have an hour dedicated to someone helping me learn.

Feedback, feedback and feedback

With our performance year coming to an end this month, the inevitable overflow of feedback requests have been hitting my inbox this week. 

One of my struggles with this time of year is determining what warrants feedback and potentially turning down requests where not appropriate. 

As a firm we have our professional framework which, whilst important, feels unfair/unfit for purpose when, for example being asked to score someone against “global acumen” if the work they did was help me out on something small locally. Similarly, I often find people request feedback as a means to showcase they’ve completed work, rather than using it for a constructive conversation centred on development. If that’s the reason for a feedback request then surely we’ve lost the spirit of it?

So yes, I really struggle with this time of year, also as I find it increasingly challenging with what we do to quantify the impact myself and our team is having on the organisation. 

How do you quantify internal coaching impact? Number of people trained? Training NPS? Number of Agile projects vs. Waterfall? Number of teams coached? New products launched using Agile principles? Portfolio WIP trend? Portfolio/team cycle time? Individual feedback?

I’m still learning about what we can look at empirically in supporting what we do, but for now have settled on a blend of all the above in terms of my own performance appraisal. 

Before you ask, yes, we are still doing annual performance reviews. 

Mid-year reviews take place as a checkpoint and more of an informal discussion, but end of year is when you get your performance rating which may/may not be attributed to a pay increase and/or bonus. 

The majority of people I talk to express surprise/dismay we still do it this way.
I’ll put that down as one for the cultural debt backlog to be addressed long term…

Training

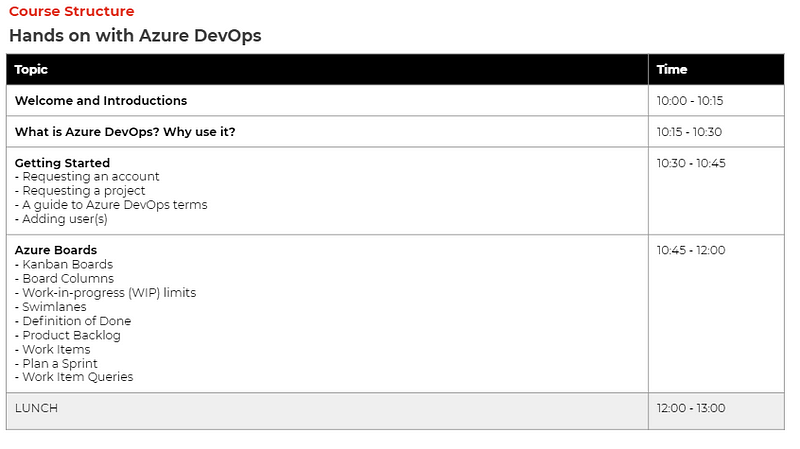
Today I’ve been running another Hands On With Azure DevOps session, this time for folk in our Consulting team. The session has gone well, with pretty much all attendees feeding back that they had learnt a thing or two, which is the main thing for me. One particular feedback was that it was “the best training someone has been to in the past year” — I didn’t stop to ask if this was the only training they had been on ;)

The course is structured like so:

I learnt that I didn’t have the right setup for enterprise licenses today, which meant a number of people couldn’t move work items on the board — not ideal! However I found a workaround through pairing and learnt about what I need to fix for next time…so a good day for me on the learning front as well.

For those of you who are users, I’d love to hear if you have any feedback on the above and if you think there are significant gaps for first time users.

Next week

Next week I’ll be finishing my performance appraisal, putting my Google Sites learning into practice, and heading up t’north to our Manchester office for an Agile Foundations session. Looking forward to a week of reflection, learning and starting others on their Agile journey.
Weeknotes #02 - On the road again…

Wroclaw (Vrohts-wahf)

As I mentioned in closing last week, I headed out to Wroclaw (pronounced Vrohts-wahf) to visit one of our suppliers this week.

Accompanied by Jon, Andy and Stuart we had 3 days of good discussion on Agile, DevOps, Product Management, UX, Data Science, Security and, what is fast becoming my favourite topic, anti-patterns. 

Whilst there was some really impressive stuff that we saw, mainly from a technical practices perspective, there were a number of anti-patterns identified in our *current* Agile ways of working, largely being imposed from within our own organisation. Sprint zero, gantt charts, change advisory boards (CABs) approving all deployments (even to low level environments), RAG status, the iron triangle as the measure of project success, changes in scope needing a change request to be raised — all got a mention. 

It’s clear that we still have a large amount of cultural debt to overcome. 

For anyone new to the concept of cultural debt, Chris Matts describes it well in that it commonly comes in two forms:

As a team we are very strict in our interactions with individuals that training and/or coaching must be via pull rather than push (i.e. opt-in). 

However the second point is, I feel, much tougher. Plenty of teams are wanting to plough on ahead and get a kanban board setup, do daily stand-ups and retrospectives, etc. and, whilst this enthusiasm is great, the mindset and reason why we’re choosing to work in this way is often lost.

An outcome of our discussion was creating a supplier working group to work with our team, so we can share some of the approaches we’re taking to encouraging Agile ways of working, and how we can collaborate and support, sharing data/examples to drive continuous improvement rather than taking on the organisational challenges individually.

Less is more?

We also had the last couple days of our Sprint this week as a team. 

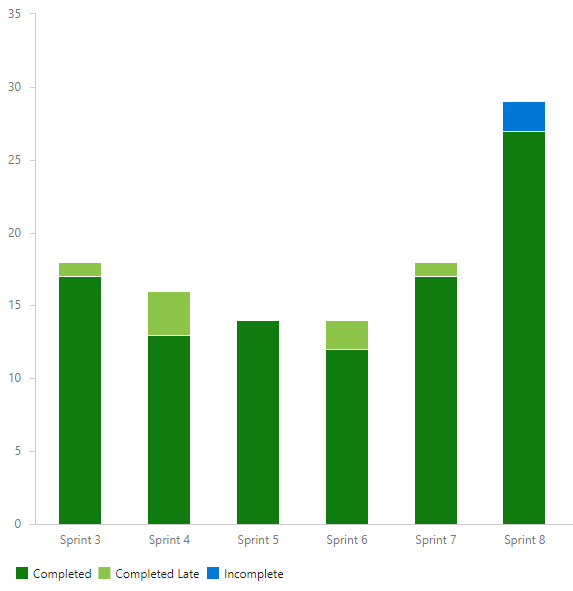
We like to work in 4-week sprints, as we find this is the right balance in cadence and as a feedback loop with stakeholders. From the end of Jan we went down to one less team member, so with five in our team I was interested see how our throughput was compared to previous sprints.

Our team throughput per sprint over the last 6 sprints

As you can see, this sprint we managed to complete more work items than in any sprint prior.

Upon review as a team, the general consensus was that we put this down to having run more training in this sprint compared to previous sprints (a training session is 1 PBI on our backlog) and that as we trained more people it spawned off more opportunities from a coaching standpoint. We’re going to stick with current team size going forward, mainly due to a good dynamic as a team and having a good variety of skillset.

Done column = 😍😍😍 (shoutout

Agile Stationary

for the stickies)

One thing we did try this sprint as an ‘experiment’ over this sprint was working with both physical and digital boards. It’s rare for us as a team to have a day where everyone is in the same office, so primary for us is a digital board. However we wanted people to also have the view of a physical board in our London office, mainly so they could see what we were working on and how a kanban board works in practice. Whilst we’ve not had loads of questions, general feedback seems to be positive and people like seeing it in action — we’re hoping it encourages others to experiment with physical and/or digital versions of their workflow.

TIL Python

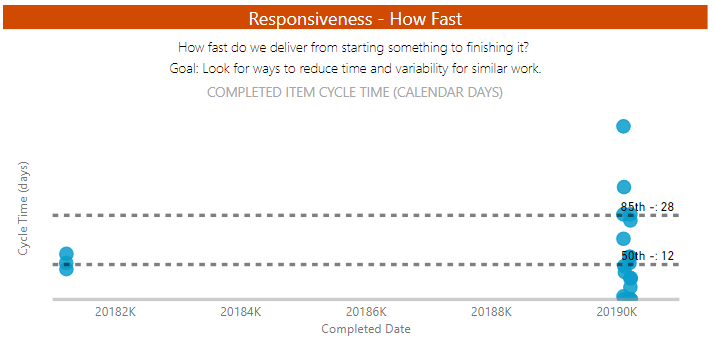
One learning I have made this week is I’ve picked up a little bit of Python knowledge. One of my biggest frustrations with FlowViz has been how the Scatter Chart within Power BI cannot handle date values and can only use whole numbers in the X-axis, therefore needing a date string (i.e. 20190301) which of course, is then treated as a number rather than a date (so 20,190,301) leading to a rather bizarre looking scatter plot.

And the award for most useless Scatter Chart goes to…

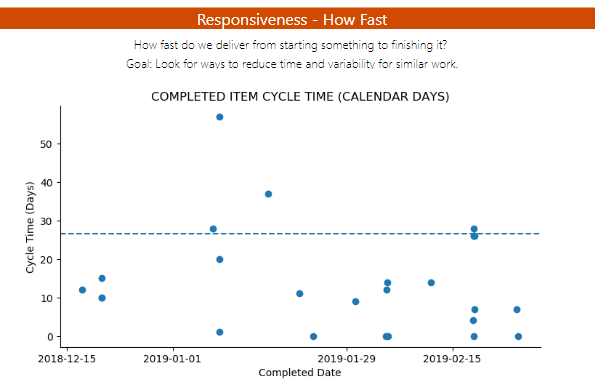
However this week Microsoft announced that python visuals are now available in the web service and hence, I could ‘code’ my own python chart to display the scatter chart how I really wanted it to be.

After some browsing of the web (read: Stack Overflow) I managed to get a scatter chart working with my dataset. However I needed the brilliance of Tim in our Data Science team to help get the dates working how they should be (checkout his Tableau public profile btw), as well as clean up the axis and add my percentile line. It’s not *done done* yet as it needs a label for the percentile line but I’m pretty pleased with how it is now looking.

Much better (thanks Tim!)

Next Week

Next week I’m running what I hope will be the polished version of our Hands on with Azure DevOps course for a group of 20 in Consulting. 

I’ll also be learning about Google Analytics, as we launch our Partner Up initiative where senior staff pair up with someone junior who then demos and coaches the more senior person about a new tool/technology, all in the spirit of creating a learning organisation — looking forward to sharing my own learnings with you all next week.

Weeknotes #01 - The Week That Was!

Why weeknotes?

Recently, I’ve been inspired a lot by reading the Weeknotes of both Sam Lewis and Rita Goodbody, who are doing some excellent work with Novastone Media. What’s great about their work is that each week they share their learnings (please give them both a follow!), both being very open around challenges they’re facing, accomplishments they’ve made each week and share their stories. After getting into the habit of checking Twitter on a Friday afternoon for their latest posts, I figured why not give it a try myself. 

Special mention to Sam who I have known for a while now through the Kanban world, who first introduced me to the concept. 

Like him I really like this point:

Writing creates a basic feedback loop. Before getting feedback from other people, you can literally get feedback from yourself.

So yes, this will be something I’ll be trialling for a bit…

Helping others learn, whilst learning myself

This week I ran a ‘Hands on with Azure DevOps’ session for our Project Management group. Having been asked by another area of PwC to run a similar session in March, I offered out the opportunity for the PM’s to be the first to experience it…with the proviso that it was the first iteration so not everything would work smoothly! 

One thing I have learned in adoption of new tools is just showing how to use it isn’t enough, so I created a sandbox Azure DevOps collection/organisation setup each attendee with their own project, then showing them how to do something, then they get to create their own variation within their environment. I had printed workbooks as a supporting tool (in case they got stuck), but deliberately only had enough for one per pair, forcing a bit of collaboration. A few things went wrong, mainly in how I structured the first bit of the course by having them create multiple teams, on reflection I realised that keeping it simple and using the default team would have been better. Generally, people said they really enjoyed it and that it has helped them learn a lot more, with also some feedback that the pace was maybe a little too quick, so there’s a bit of learning for me as well around my delivery.

Training, training and more training

The rest of the week has been mainly filled with continuing internal enablement through our team running 1-day Agile Foundations courses. 

On Tuesday I paired up with Marie to run a session, and yesterday myself and Dan delivered another. I’m shocked that so many people have signed up (out of a function of 220 people, 180 people will have attended by the end of March), as we were very clear in wanting people to “pull” the training, rather than be forced to attend. One person who attended yesterday said in the intro that they had ‘high expectations’ because they had heard so many good things, which was nice to hear and set the tone for a good day. Based on the feedback we received it seems all attendees really enjoyed it. One individual let us know that it was “probably the best training they have been to in years” which, whilst very flattering, does make me wonder what other training they have attended!
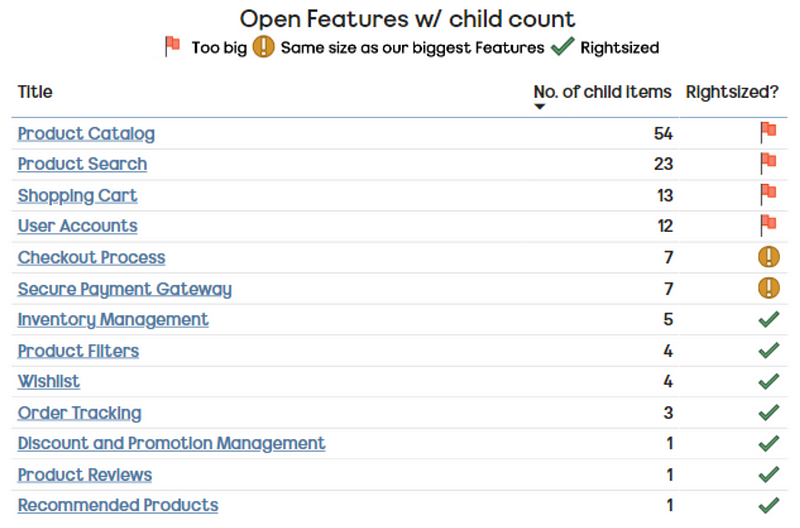
Mid-flow on my favourite topic (metrics)

The course itself is very hands on, we’re keen to give people the principles and also dispel some myths that Agile = Fast and/or Agile = Scrum, something which is a bit of a personal bugbear of mine. We introduce the manifesto and the principles then support that with a game of Agile Eggcellence, then cover Scrum before lunch (using the Scrum guide — not some internally warped version of Scrum) as well as the often overlooked technical excellence aspects such as CI/CD. After lunch we introduce the Kanban method using Featureban, then go into User Stories, Minimum Viable Product, again supporting that with some examples and the Bad Breathe MVP game.

Final section of the day is centered on business agility — here we look at INGs Agile Ways of Working journey (to inspire — not to copy/paste!), the outputs from the State of DevOps report, as well as internal/client case studies. 

The main thing here is in an IT context to open up the discussion around what our impediments are and, more importantly, how can we collectively overcome them. Once that’s done we finish with a game of “40 seconds of Agile” — a variation on 30 seconds of Scrum with some Pocket Scrum Guides for the winning team.

Marie and Dan have both grown into the delivery of the training incredibly well. When we first started these sessions it was myself doing the majority with themselves supporting, whereas now most sessions are split 50/50. 

They are both also great at weaving in their own experience/stories into their delivery which for me, adds a further element of ‘realism’ for attendees. I’m very fortunate to work with them (as well as James and Jon in our team) as part of our Agile Collaboratory team, in particular due to their enthusiastic yet pragmatic approach.

Going for (Agile) Gold

Eyes closed — no gold medal for being photogenic

Wednesday night we held our first Agile Olympics event within one of our London offices. The event was in two parts, for the first half teams were given a case study around product decomposition and had a roughly an hour to analyse a case study and do some initial visioning around the product and producing a vision with various increments as part of it. The second half was a quiz using the Kahoot app, with prizes for the top three teams for both rounds. I was heavily involved in helping formulate the case study and write the quiz, as well as being one of the main judges for the case study outputs from the teams. It was a really fun event, with nine teams across different business lines entering. All of them did a great job in focusing on user needs and business outcomes for their product, rather than outputs and making a list of features. Some Partners appeared to be a bit upset at their quiz performance and demanded copies of the answers which, given the quiz contained a number of anti-pattern questions (what is Sprint Zero, etc.) shows to me we still have work to do internally. We’re hoping this is the start of many events where we can grow the Agile & DevOps coaching network across the UK.
Project to Product

Over the Christmas period, I found myself immersed in Mik Kersten’s Project to Product book. For me, the book is brilliant and very much represents the future of work for large organisations that they need to adopt in order to remain relevant/successful. Product thinking and the whole #NoProjects movement has been a keen interest of mine in the past two years, with us slowly starting to introduce some of that thinking internally. The past few weeks we’ve been formulating our first Value Stream which, for our context will be a service (with a set of long-lived products) or a major product, with multiple teams within the value stream supporting that delivery.

One of the things we’ve been looking at is the roles within a value stream, whilst teams will self-organise to choose their own framework/ways of working, what should be the role of the person ‘owning’ that value stream?

The working title we have gone with is a Value Stream Owner (VSO), with the following high-level responsibilities:

The owner for the Value Stream must be able to manage, prioritise and be responsible for maximising the delivery of value for PwC, whilst staying true to Lean-Agile principles. 

Specifically, there is an expectation for this individual to be comfortable with:

  • Small batch sizing (MVPs/MMFs), prioritisation and limiting work in progress (WIP)

  • Stakeholder management and potentially saying ‘not yet’ to starting new work

  • Learning and understanding flow metrics, using these to gain better insight and improve the flow of value

  • Inspect and adapt — You will be familiar with the concept of ‘inspect and adapt’ and showcase that in your work

  • Focusing on business outcomes over outputs

  • Ensure that continuous improvement is at the core of everything you do and that you encourage all members of the value stream to be on the lookout for new and better ways of creating value

It’s proving to be challenging, mainly due to finding suitable groupings for such a large IT estate, but we’re getting there…hoping to formulate the team(s) in the next 2 weeks and start working through the Value Stream backlog.

Next week

Next week I’m heading out to Wroclaw, visiting one of our suppliers which should be interesting (I get to meet their Tribes — and no they are not a music streaming company!). Travelling abroad always presents a challenge for me, I don’t like compromising on not attending key meetings in the UK just because I’m out of the country, so will be a delicate balancing act of getting value from the trip vs not getting behind on other work. I’ll be sure to share next week how that goes.

Using data visualisation to aid deadline driven Agile projects…

Quite often in the agile world, you will come across pieces of work that are deadline driven.

Whilst it can be negotiated in some instances, other times it’s just something we have to deal with as this is the world we live in.

Some people (myself included) are focused on delivering value continuously, whereas others still have a deadline orientated mind-set because, it may be the only way they’re familiar with working, it may be imposed upon them (legislative/regulatory for example) or quite simply this may be the only way they motivate themselves to actually do the work.

For these scenarios we need to know how best to handle this when working on agile projects as one of our biggest challenges is how to manage the delivery when working to a deadline.

You will have stakeholders/PO’s/management pressuring you to ‘meet a deadline’ yet unwilling to compromise on scope.

“You have to deliver it all” is a typical response for those that have not had the benefit of coaching on what agile truly means, and it can create an unnecessary pressure on the team.

So how do you tackle this?

Well for one, we know that delivering “everything” directly contradicts agile principles.

Remember, Agile is about working smarter, rather than harder.

It’s not about doing more work in less time; it’s about generating more value with less work.

You will need strong customer negotiation/stakeholder management (as well as a lot of patience!) skills to get this message across, relying on management where needed to help support you.

What I find the most helpful in these scenarios is showing stakeholders that if they want ‘everything’, just how long it will take.

For those curious on how best to get this message across visually, a follow on post will show you how you to do this using data/probabilistic forecasting.

However, our question today is deadline driven. 

So how can we do this visually?

Potentially Deliverable Scope (PDS) Chart

This chart uses Monte Carlo simulation and the actual movement of cards across a team's board to predict how far down the backlog a team will get for a specified budget or timeline for a selected project or release.

The model predicts the ‘Probable’ and ‘Possible’ deliverable scope, which helps the business focus on the marginal scope.

Take this example chart (generated 14th Feb) with a finish date of 3rd March for a project/release:

The chart represents the current backlog order, as well as the sizes of each backlog item being relative to the points estimate per PBI (user story).

Pink items are currently In Progress, Grey items are To Do. 

The title, person assigned to (removed for the purposes of this data) and unique ID for a backlog item is also visible, with the ability to click on an item taking you to the actual backlog item in your respective tool (Jira, TFS, etc.).

There are 3 areas to look at:

1) Anything above the ‘Probable’ Line

These items will almost certainly be delivered. 

As you’ll see for this team that is currently everything that is In Progress.

2) Anything below the ‘Possible’ Line

These items will almost certainly not be delivered, however if a stakeholder sees something we are definitely not going to get to, this allows them to visually see the priority of an item and if this needs to be moved up/down the backlog priority.

3) The scope that *could* still be delivered

This should be the area that everyone focuses on.

This is where the team *could* get to by the deadline if the team and business work through the priorities to improve throughput. This could be through story slicing, closer collaboration, etc.

This chart can be run every few days, with the ability to change date/data range used, scope change, throughput increase or an increase in any rework needed.

This is hugely beneficial when wanting to visualise using data (rather than speculation) how far down the backlog you will get by a given date, which will in turn significantly help in managing those tough questions from stakeholders.

For those interested in exploring this further, please reply below or get in touch directly.