Project to Product nudges for large organisations

As large and typically “traditional” organisations start to embark, maintain momentum or pivot on their journey with new ways of working, the buzzwords of “Project to Product” are likely to be in the conversation in your organisation.

One of the primary drivers of this has been the book of the same name from Mik Kersten. Whilst the book is no doubt useful, it does not quite delve into the practical application within your organisation, particularly around various aspects of product management.

In a recent Twitter interaction with Chris Combe, I felt the questions he was asking were very much in-line with questions I had/get asked about in organisations on this journey:

Original tweet

The following is a summary of thinking I’ve been encouraging and questions I’ve been asking in recent weeks (as well as over the past few years in different contexts). These are what I believe to be appropriate nudges in the different conversations that will be happening in the different parts of an organisation on this project to product journey. To be clear, it is not to be confused with a framework, model or method, these are simply prompts (or tricks up your sleeve!) that I believe may help in progressing conversations you may be having.

Defining product

One of the first challenges faced is actually defining what is a product in your context. You don’t need to reinvent the wheel here, with plenty of good collateral out there in the industry already. A starting definition I like to use is:

Product — something that closely meets the demands of a particular market and yields enough value to justify its continued existence. It is characterised by its benefits, features, functions and uses that satisfy the needs of the consumer.

Due to the fact many folks will be used to approaching work from a project perspective, it helps to clearly articulate to people what the differences between the two are. In it’s most simple form, I like to go with:

Project — a temporary endeavour undertaken to create or deliver a solution, service or result. A project is temporary in that it has a defined beginning and end in time, and therefore defined scope and resources.

However, definitions alone are not enough and you will find be left open to interpretation. There is already good information on the key differences out there already, such as this paper from IT Revolution, or this neat graphic from Matt Philip’s blog post:

Further reading -

Project to Product Whitepaper

Be prepared to be able to talk to this at detail with folks, explaining how some of the thinking may work currently in your organisation and what that may look like differently with this lens over the top.

IT Applications (Technology Products)

It’s highly likely given the software lens of the Project to Product book that the immediate focus on product definition will be in Technology/IT. If that’s the case, it might help to elaborate one step further with the following definition I like to use:

Technology Product — commercial and/or internal technology product that adds value to the user. Products may be assembled from other products, using platforms and/or unique components.

I find this definition works quite well in the myriad of application, operations, platform and component teams most large organisations start off with. In particular it allows people to start thinking about what part they may play in the bigger system of work.

SNow way all those are products!

One experience you might have is similar to what I’ve observed (in two large organisations now) which is where folks tend to fall into the trap of thinking that just because you can raise a ticket against something in ServiceNow (SNow), then that’s a product. In my role prior to Nationwide, some IT Service Management folks (who actually were one of the strongest advocates in moving to this way of working) were trying to get ahead of the curve and unfortunately made this same mistake. They extracted the configuration item records from ServiceNow, finding there were over 800 applications in our IT estate. Which prompted a flabbergasted view of, “we’ve got 800+ products, so we’re going to have 800+ teams?!?!”

First of all, chances are pretty high that a number of these are not actually products! As part of this move to new ways of working, use it as an opportunity to consolidate your estate (or what will hopefully become known as your product portfolio). For one, you’re likely to find items in the list that are already decommissioned yet the records have not been updated.

Another question is around usage — this is where you refer back to your definition of product. How do you know it’s used? Do you have any telemetry that points to that? In the example I mentioned there was practically no analytics on usage for nearly all 800+ applications. As a proxy, we took the decision to start with incident data, making the assumption that those applications with higher call volumes were likely to have high usage. Those without an incident raised for 2 years are candidates to investigate further, becoming retired and not a part of our product world.

You can also use this as a learning point when incrementally moving to product teams. For those initial pilots, a key data point should be embedding that product telemetry to validate those assumptions made on those “products”. Depending on your technology, some of this can be more sophisticated (more modern applications will tell you pretty much everything that happens on the user journey), whereas for older, legacy technology you may have to rely on proxy measures (e.g. number of logins).

Grouping products

Even with a consolidated list, this still doesn’t mean a 1:1 ratio for every product and product team. It’s likely a number of these products will be releasing less frequently (maybe monthly or quarterly). This does not mean you are in “BAU” or “maintenance mode” (for more on this — please read Steve Smith’s latest post), which is another unlearning needed. What you can do is take these smaller, less frequently releasing products and group them into a product family. A definition I like to use for this is:

Product Family — a logical grouping of smaller products that address a similar business need in different but related ways. They may or may not align to a specific business unit or department.

What you may then choose to do is logically group these products / product families further. This however is highly context dependent, so be prepared to get this wrong! In Nationwide we use Member Needs Streams, within three long-lived Missions. This absolutely works for those in the Missions working to delight Members needs, however becomes more troublesome if you’re in an area working to the needs of colleagues rather than members (for example, we have a shared technology platform area with multiple teams). You may choose to go with Value Streams, however this can often be misinterpreted. I’ve had this experience in two organisations, prior to Nationwide the organisation simply couldn’t get their head around what a value stream truly was. More recently, within Nationwide, some folks have baulked at a value stream as it is wrongly misinterpreted as extracting value from members, aka treating them the same as shareholders, which is not what we want and is a distinguishing factor for us being a mutual.

In making this decision, definitely explore different approaches. For example, your organisation may even have a business capability or value chain defined already. Whatever you chose, be mindful that it will likely be wrongly misinterpreted. Be armed with real examples of what it is and is not, specific to your context.

Products for other departments (i.e. not just IT!)

Once you’re aligned on product definition, questions will arise from those teams who do not ‘build’ technology (IT) products. What products do they have? Thankfully there is again thinking already in this space, with this great blog from Jeff Gothelf that articulates how other departments in the organisation can think about what they offer to the rest of the organisation as “products”.

Source:

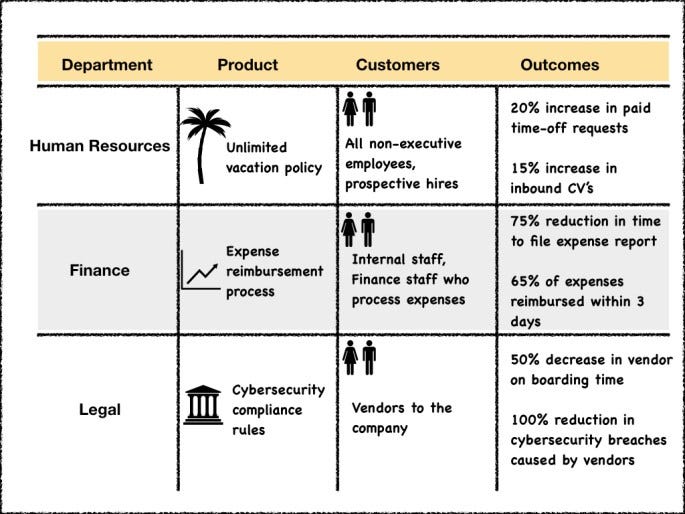
Do HR, Finance and Legal make products?

When we consider our context, within Nationwide we recently announced changes to our approach with remote working, going with the slogan of Locate for our day. This is essentially the formal recognition that we’re now increasingly seeing hybrid events with our way of working, remote and flexible working is here to stay, however there will be instances where in person collaboration may be more effective, therefore it’s a collective (our) decision on work location. You could articulate this with a product lens, like so:

Defining non-technology products may be something that comes later on the journey (which is fine!) but experience tells me it helps to have applied this thinking to your organisation so that when the conversation inevitably happens, you have some ready made examples.

Not everything is a product/not everyone will be a Product Manager

Another trap to avoid is going too far with your ‘product’ definition. Consider your typical enterprise applications used by pretty much everyone, taking Microsoft Teams as an example. It would be unfair (and not true) to put someone in a Product Manager role and say they are the Product Manager for MS Teams. Imagine introducing yourself at a conference to peers as the Product Manager for MS Teams (when working at say, Nationwide) — I’m sure that would confuse a lot of people! If you can’t make priority decisions around what to build then don’t kid yourself (or let others fool you!) into thinking you’re a Product Manager. This will only damage your experience and credibility when you do move into a product role. Similarly, don’t move people into a Product Manager role and not be clear on what the products are. This is again unfair and setting people up to fail, feeling lost in their new role.

Product Teams

With clarity on what a product is and the types of products you have in your organisation, it’s also important to consider what your organisation means by product teams. In my view, the best description of a product team (or what you should be aspiring to get to) is from Marty Cagan, in both the book Inspired and the Silicon Valley Product Group (SVPG) blog (here and here).

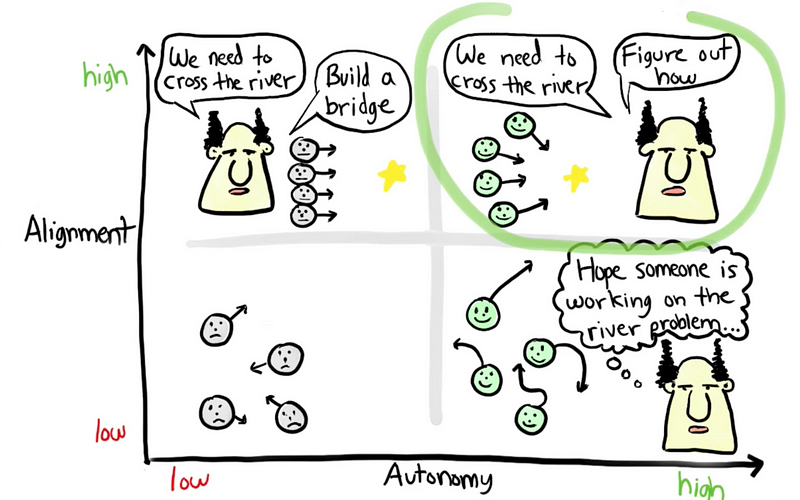
Unfortunately, most people don’t have time (or at times, a desire!) to do further reading, therefore something quick and visual for people to grasp is likely to aid your efforts. John Cutler has a handy infographic and supporting blog around the journey to product teams:

Source:

Journey to Product Teams

In my experience, use this to sense check where you are currently, as well as inform your future experiments in ‘types’ of product team. It also isn’t a model, so don’t think you need to just go to the next row down, you can skip ahead a few rows if you want to!

Tailoring language to your context is important too, for example ‘Run’ may be ‘Ops’ in your world — help it make sense to people who have never done this before, avoid new jargon unless you need to do that in order to make a clear distinction between x and y. The second from last row (Product Team w/ “mini CEO”) may be the end state for a lot of teams in your organisation, but it doesn’t mean you can’t experiment with having some ‘truly’ Product Teams (the last row).

Product Management Capability

A final nudge for me would be focusing on capability uplift within your people. This way of working will excite people, in particular those who like the idea of/have read about Product Management as a career. Whilst you should definitely capitalise on this momentum and positivity, it’s important to ensure you have people experienced in your organisation flying the flag / defining what “good” looks like from a product management perspective.

If your people are learning from YouTube videos (rather than peers) or taking on a role not knowing what Products they’ll be Product Managers for, or your most senior people in the “Product” part of the organisation (Community of Practice or Centre of Excellence) have never been in a product role, chances are your efforts will fall flat. And no, before you think about it, this ‘expertise’ will not come from the big 4! Be prepared to have to recruit externally to supplement that in-house enthusiasm with a group of people who can steer the ship in the right direction.

Summary

Hopefully this helps you and your context with nudging some of your thoughts in the right direction. Like I said it is by no means a model or “copy and paste” job, simply learnings from a practitioner.

What about your own experiences? Does any of the above align with what you have experienced? Have I missed things you feel are important nudges too? Let me know in the comments :)

There’s no such thing as a committed outcome

A joint article by both myself and Ellie Taylor, a fellow Ways of Working Enablement Specialist here at Nationwide.

The Golden Thread

As we start a new year, focusing on outcomes has been a common topic of discussion in our work in the last few weeks.

Within Nationwide, we are working towards instilling a ‘Golden Thread’ in our work — starting with our strategy, then moving down to three year and in-year outcomes, breaking this down further into quarterly Objectives and Key Results (OKRs) and finally Backlog Items (and if you’d like to go even further — Tasks).

This means that everyone can see how the work they’re doing fits (or maybe does not fit!) into the goals of our organisation. When you consider the work of Daniel Pink, we’re really focusing here on that ‘purpose’ aspect in trying to instil that in everything we do.

As Enablement Specialists, part of our role is to help coach the leaders and teams we work with across our Member Missions to really focus on outcomes over outputs. This is a common mantra you’ll hear recited in the Agile world, with some even putting forth the argument that it should in fact be the other way round. However, orientating around outcomes is our chosen path, and thus we must focus on helping facilitate the gathering of good outcomes.

Yet, in moving to new, outcome oriented ways of working, a pattern (or anti-pattern) has emerged— one of which is the concept of a ‘committed outcome’.

“You can’t change that, it’s a committed outcome”

“We’ve got our committed outcomes and what the associated benefits are”

“Great! We’ve got our committed outcomes for this year!”

This became a hot topic amongst our team — what really is an outcome and is it possible to have a committed outcome?

What is an Outcome?

If we were to look at a purely dictionary definition of the word, an outcome is “something that follows as a result or consequence”. If you want help in what this means in a Lean-Agile context, the book Outcomes over Output helpfully defines an outcome as “a change in human behaviour”. Which we can then tweak for our context to mean ‘something that follows as a result or consequence, which could also be defined as a change in member or colleague behaviour’.

However this definition brings about uncertainty. How can we have certainty over the outcomes given they’re changes in behaviour? Well a simple way is to call them committed outcomes. That way we’ll know what we’ll be getting. Right?

Well this doesn’t quite work…

Outcomes & Cynefin

This is where those focused in introducing new ways of working and particularly leadership should look to leverage Cynefin. Cynefin is a sense-making model originally developed by Dave Snowden to help leaders make decisions by understanding how predictable or unpredictable their problems are. In the world of business agility, it’s often a first port of call to help us understand the particular context teams are working in, and then in turn how best to help them maximise their flow of work by selecting a helpful approach from the big bag of tools and techniques.

The model introduces 4 domains: Clear, Complicated, Complex and Chaotic, which can then be further classified as predictable or unpredictable in nature.

There is also a state of Confused where it is unclear which domain the problem fits into and further work is needed to establish this before attempting to identify the solution.

Source:

About — Cynefin Framework

Both Clear and Complicated problems are considered by the model to be predictable since they have repeatable solutions. That is, the same solution can be applied to the same problem, and it will always work. The difference between the two being the level of expertise needed to solve.

The solution to Clear problems is so obvious that a child can solve it, or if expertise is needed the solution is still obvious and there’s normally only one way to solve the problem. Here is where it’s appropriate to use “best practice”. [example: tying shoelaces, riding a bike)

In the Complicated domain, more and more expertise is needed the more and more complicated the problem gets. The outcome is predictable because it has been solved before, but it will take an expert to get there. [example: a mechanic fixing a car, a watchmaker fixing a watch]

The Complex and Chaotic domains are considered unpredictable. The biggest difference between the two from a business agility perspective is whether it is safe to test and learn; ‘yes’ for Complex and definitely ‘no’ for Chaotic.

Complex problems are ones where the solution, and the way in which to get to that solution (i.e. the practices) emerge over time because we’ve never done them before, in this context, environment, etc. Cause and effect are only understood with hindsight, so you can only possibly know what happens and any side-effects of a solution once created. The model describes this activity as probing, trying out some stuff to find out what happens. And this is key to why this domain is a sweet spot for business agility. We need to try out something in such a way, typically small, that ensures that if it doesn’t work as expected, the consequences are minimised. This is often referred in our community as ‘safe to fail.’

And finally, Chaos. This is typically a transient state; it resolves itself quickly (not always in your favour!) and is very unpredictable. This domain is certainly not a place for safe to fail activity. Decisive action is the way forward, but there is also a high degree of choice in the solution and so often novel practices emerge.

Ok, so what’s the issue?

The issue here is that when we think back to focusing on outcomes, and specifically when you hear someone say something is a committed outcome, what’s more likely is that it’s a (committed) output.

It’s something you’re writing down that you’re going to ‘do’ or ‘produce’. Due to the fact that most of what we do sits in the Complex domain, we can’t possibly know (for certain) whether what we are going to ‘do’ will definitely achieve the outcome we’re after until we do it. We also don’t even know if the outcome we think we are after is the right one. Thus, it is nonsensical (and probably impossible!) to ‘commit’ to it. It’s unfortunately trying to apply thinking from the Clear domain to something that is Complex. This is a worry, as now these outcomes become something that we’ll do (output) rather than something we’ll go after (outcome).

In lots of Agile Transformation or Ways of Working initiatives, this manifests itself at team level where large numbers of Scrum teams are stuck in a world where they still fixate on “committed number of items/story points” — ignoring the fact that this left Scrum ten years ago. Scrum Teams commit to going after both long-term (product) and short-term (sprint) goals, expressed as outcomes, with the work they do in the product/sprint backlog being how they’re trying to go after those. They do this because they know their work is complex. The same goes for the wider organisation wide ‘transformation’, which is treated as a programme where, by a pre-determined end date (usually 12 months), we will all be ‘transformed’. This of course can only be demonstrated in output (number of teams, number of people trained and certified, etc.) due to the mindset it is being approached with.

The problem with committing to an outcome (read: output) is that it stifles empowerment, creativity, and innovation, turning your golden thread from something meaningful, purposeful that celebrates accountable freedom, to output oriented, feature factory measured agile theatre.

Ultimately, this means any new ways of working approach is likely to be sub-optimal at best — it’s a pivot without a pivot, leading to everyone in the system delivering output, delivering this output faster, yet perplexed at the lack of meaningful impact. Meaning we neglect the outcomes and experimenting with many ways in our real desired results of delighting members and colleagues.

What we want to focus on are the problems we want to solve, which comes back to the member, user or colleague behaviours that drive business results and the things we can do to help nudge these. Ideally, we’d then have meaningful and, where appropriate, flow and value based measures to quantify these and track progress.

Summary

In closing, some key points to reaffirm when focusing on outcomes:

  • Outcomes are something that follows as a result or consequence

  • Cynefin is a sense-making model originally developed by Dave Snowden to help leaders make decisions by understanding how predictable or unpredictable their problems are.

  • Cynefin has 4 domains: Clear, Complicated, Complex and Chaotic, which can then be further classified as predictable or unpredictable in nature.

  • There is also a state of Confused where it is unclear which domain the problem fits into and further work is needed to establish this before attempting to identify the solution.

  • The work we do regarding change is generally in the Complex domain

  • As the work is Complex, there is no way we can possibly ‘commit’ to what an outcome will be as the relationship between the two is not known

  • Outcomes are things that we’d like to happen (more engaged staff, happier members) because of the work that we do

  • When you hear committed outcomes — people most likely mean outputs

  • Use the outputs as an opportunity to focus on the real problems we want to solve

  • The problems we want to solve should come back to the member, user or colleague behaviours that drive business results (which are the actual ‘outcomes’ we want to go after)

What do you think about when referring to outcomes? 

Have you had similar experiences?

Let us know in the comments below or tweet your thoughts to Ellie or myself :)

The time we went to Lean Agile Exchange…

Recently I was fortunate enough to speak at Lean Agile Exchange 2021 on a topic that evolved from one of the previous posts on this blog about blocked work and its impact.

The conference setup at Lean Agile Exchange was super cool, with an interactive ‘map’ on the day taking you to an ‘auditorium’ where you could pick from any of the live talks in progress on the three respective tracks.

As well as speaking at the event, there were another 25 Nationwide folks in attendance across the two days! As part of our commitment to shared learning, here are some of those who attended and their key takeaways…

Kylie Upton — Product Owner (Landlord Member Needs Stream)

Which session was your favourite? Why was that?

This is an incredibly hard question to answer, however, if pushed I would say personally, I found the session “You gotta water your own plants” from Arika Pierce resonated the most with me.

The idea of how I continue to grow and develop is top of mind for me right now. I have found that over the last year I have almost completely dropped personal development activities. I used to spend a day every week and now I am barely doing an hour. This session gave me the motivation to get back to investing in myself. It also contained a number of great tips for how I can take the next few steps in my career. In particular, I am going to work on shifting from doing to delegating and I will be creating what the speaker called a “not to-do list”.

What were some of your learnings you picked up on from attending other sessions?

The three main learnings I took from other sessions are:

  1. We should be properly tracking our sprints for capacity and flow

  2. We have a responsibility as a team to ensure everything we are building is ethical and we should be looking at the potential consequences of things we are doing

  3. The Spotify model was never meant to be a model but just something that worked for them

What’s the one thing you took away that you’re going to look to implement with your team(s) straight away?

Of the three learnings mentioned above I am definitely going to be working with my Delivery Manager and Tech Lead to implement point one. We are not doing a great job of understanding how much work we put into a Sprint and how things are flowing through. The other learnings I will be keeping in mind as I continue to work with my teams to adapt to new ways of working.

Is there anything else you’d like to share about your experience of the event?

We’ve now been living in a pandemic laden world for almost two years now. I have managed to get used to working from home, video chatting friends and not ever seeing the bottom half of people’s faces. However, the one thing I don’t think I’ll ever get used to are virtual conferences. I have now attended four virtual conferences, and although I am very grateful for the opportunity and the insight I gain, I don’t think they will ever match the value of in person events. The biggest thing I missed from this conference and every other conference I have attended during “the covid years” (if you can use that) was the opportunity to network. The opportunity to talk to other people doing a similar job to me and see what they are finding hard or what they have learned. Hopefully we will be able to go back to in person conferences soon.

Megan Harrison — Scrum Master (Home Member Needs Stream)

Which session was your favourite? Why was that?

My favourite session was the closing talk on Day 1: The magic of human connections. I think human connection is what underpins everything we do so it was really interesting for me to listen to a talk that focussed on this and the science behind it. In this session Emily Webber spoke about our innate need to connect with others. Taking Maslow’s hierarchy of needs for example — if we don’t prioritise social needs, then who is going to help us achieve our physical needs? We need others in order to have shelter and food.

Taking this thinking into our work lives, we need to ensure we build relationships with our teammates and others around us to allow us to get the most out of our work. Fostering an environment where people feel safe to speak openly and honestly with one another. This is even more important now that we spend so much time working remotely because we no longer experience…

So even though it may seem daunting at times — we need to make that extra effort to experience the magic of human connections.

What were some of your learnings you picked up on from attending other sessions?

  • Arika Pierce spoke about ‘trimming off the dead leaves’ in “You gotta water your own plants — how to grow and thrive as a leader”. And by this she was referring to embracing failure, failing early and often, and moving on. If something goes wrong, just trim off the dead leaves and things will come back to life with new growth.

  • Joakim Sundén reminded us all in “So you copied the Spotify model — here’s what you got wrong” that, just because it seems as though the BNOCs (big names on campus) are doing something and it’s working for them, doesn’t mean it’s going to work for you. Imitation is the sincerest form of flattery and all that, but before you imitate someone ask yourself “Why is it working so well for them? What do I need to adapt to make this thing work in my circumstances?”. And also remember, if it’s something the BNOCs were doing 5 years ago, is it likely still the best idea?

What’s the one thing you took away that you’re going to look to implement with your team(s) straight away?

The main message from the Keynote on Day 1 — look to find opportunities in uncertainty.

Is there anything else you’d like to share about your experience of the event?

This was my first virtual conference and although it wasn’t quite the same as being in the same room as the speaker and the other guests, it was managed really well with multiple Slack channels, a “site map” on the website where you could go into different zones, recordings of talks you might’ve missed, and loads more things. So I guess I just wanted to share that if you are going to host, or attend, a virtual event — do your best to ensure there’s plenty of ways for the guests and speakers to interact with one another, and make the most of those channels. Also — it might be a nice idea to get together with someone else who’s attending and watch talks together (with snacks, obvs).

Ade Olowofela— Scrum Master (Speed Layer)

Which session was your favourite? Why was that?

The Lean Agile Exchange virtual conference was loaded with enlightening sessions delivered by seasoned Agile professionals from across the globe. Out of the array of topics presented, ‘Creating psychological safety in teams’ presented by Mehmet Baha, a reputable Senior Consultant in Agile Mindset and team collaboration really stood out for me. It was an exceptional interactive session which was a lot different from a conventional keynote speech. It involved breakout session and case studies from real life organisations such as Pixar and the US Healthcare sector.

High performing teams require psychological safety and should be able to share knowledge, concerns, questions, mistakes and hard formed ideas without the fear of being punished or humiliated. As Agile leaders, it’s essential to create an environment that empowers team members to make decisions, explore new ideas for innovation, openly share mistakes, foster trust and respect as well as enable constructive conflict for the team to embrace different ideas and views.

What were some of your learnings you picked up on from attending other sessions?

One was the key phrase that I picked up from Nick Brown’s (not a sponsored plug we promise!) session on ‘The importance of being blocked’ — “impediments are not in the path, they are the path”. This phrase resonates and changed my perspective of dealing with blockers as what stands in the way will become the way.

What’s the one thing you took away that you’re going to look to implement with your team(s) straight away?

My key takeaway was from the breakout session of the Psychological Safety talk where I joined other participants to discuss the different types of mistakes that could happen and the practical approach to provide an environment where team members feel free to share their mistakes, brainstorm for actions to navigate, learn from the mistake, adapt and thrive.

Furthermore, in order to evaluate and improve the psychological safety within my team, I will be exploring different themes for Retrospectives such as the Explorer, Shopper, Vacationer and Prisoner (ESVP) theme to prompt team members to express their level of engagements and overall psychological safety.

Conclusion

Overall, it’s fair to say everyone who attended Lean Agile Exchange 2021 took many learnings away, with it clearly adding value to us as an organisation and the journey we are on — looking forward to the next one! Comment below if you attended and want to share your learnings :)

Capacity planning in less than five minutes

Source:

Memes Monkey

Following on from my recent Story Pointless series, I realised there was one element I missed. Think of this like a bonus track from an album, I’ll take Ludacris’ Welcome to Atlanta if we’re talking specifics. Anyway, quite often we’ll find that stakeholders are less interested in Stories, instead focusing on Epics or Features, specifically how ‘big’ they are and of course, when will they be done and/or how many of these will they get. Over the years, plenty of us have been trained that the only way to work this out is through story point estimation of all the stories within said Epic or Feature, meaning we get everyone in a room and ‘point’ each item. It’s time to challenge that notion.

A great talk I watched recently from Prateek Singh used whisk(e)y in helping provide an alternative method of doing so, distilling the topic (see what I did there) into something straight forward for ease of understanding. I’d firmly encourage anyone using or curious about the use of data and metrics to find the time to watch it using the link below:

LAG21 — Prateek Singh — Drunk Agile — How many bottles of whisky will I drink in 4 months? — YouTube

Whilst I’m not going to spoil the session by giving a TLDR, I wanted to focus on the standout slide in how to do capacity planning approach using probabilistic methods:

As you’ll know from previous posts, using data to inform better conversations is something which is key to our role at Nationwide as Ways of Working (WoW) Enablement Specialists. So again let’s use what we have in our context to demonstrate what this looks like in practice.

Putting this into practice

Before any sort of maths, we first start with how we break work down. 

We take a slightly different approach to what Prateek describes in his context (Feature->Story work breakdown structure).

Within Nationwide, we are working towards instilling a ‘Golden Thread’ in our work — starting with our Society strategy, then moving down to strategic (three year and in-year) outcomes, breaking this down further into quarterly Objectives and Key Results (OKRs), then Epics and finally Stories.

This means that everyone can see/understand how the work they’re doing fits (or maybe does not fit!) into the goals of our organisation. When you consider the work of Daniel Pink, we’re really focusing here on that ‘purpose’ aspect in trying to instil that in everything we do.

So with that in mind, we’ll focus on number of Stories within an Epic, as a replacement for Prateek’s Feature->Story breakdown. Our slightly re-jigged formula for capacity planning looking like so:

How many stories

We start by running a Monte Carlo Simulation for the number of stories and the period we wish to forecast for, which allows us to get a percentage likelihood. For a detailed overview on how to do this, I recommend part two of the story pointless series. Assuming you’ve read or already understand this approach, you’ll know that to do this we first of all need input data, which comes in the form of Throughput. We get this from our ThoughtSpot platform via our our flow metrics dashboard:

From this chart we have our weekly Throughput data for the last 15 weeks of 11, 36, 7, 5, 6, 6, 13, 6, 7, 4, 2, 7, 5, 4, 5. These will be our ‘samples’ that we will feed into our model.

For ease of use, I’ve gone with using troy.magennis Throughput Forecaster, which I also mentioned previously. This will do 500 simulations of what our future looks like, using these numbers as the basis for samples. Within that I enter the time horizon I’d like to forecast for which, in this instance, we’re going to aim for our number of stories in the next 13 weeks. We use this as it roughly equates to a quarter, normally the planning horizon we use at an Epic level.

The output of our forecast looks like so:

We’re happy with a little bit of risk so we’re going to choose our 85th percentile for the story count. So we can say that for this team, in the next quarter they are 85% likely to complete 77 stories or more.

Epic Size

The second part of our calculation is our Epic size. 

From the video, Prateek presented that the best way to visualise this as a scatter plot, with the feature sizes — that is the number of Stories within a Feature, plotted against the Feature completion date. The different percentiles are then mapped against the respective Feature ‘sizes’. We can then take that percentile to add a confidence level against the number of Stories within a Feature.

In the example you have 50% of Features with 5 stories or less, 85% of Features with 17 stories or less and 95% of Features with 22 stories or less.

As mentioned previously, we use a different work breakdown, however the same principles apply. Fortunately we again have this information to hand using our ThoughtSpot platform:

So, in taking the 85th percentile, we can say that for this team, 85% of the time, our Epics contain 18 stories or less.

Capacity Planning

With the hard part done, all we need to do now is some simple maths!

If you think back to the original formula:

How Many (Stories) / Epic Size (Stories per Epic) = Capacity Plan (# of Epics)

Therefore:

How many stories (in the next quarter): 77 or more (85% confidence)

Epic size: 18 stories or less

Capacity Plan: 77/18 = 4 (rounded)

This team has capacity for 4 Epics (right sized) in the next quarter.

And that’s capacity planning in less than five minutes ;)

Ok I’ll admit…

There is a lot more to it than this, like Prateek says in the video. Right sizing alone is a particular skillset you need for this to be effective.

#NoTetris

The overarching point is that teams should not be trying to play Tetris with their releases, and it being more like a jar of different sized pebbles.

As well as this, we need to be mindful that forecasts can obviously go awry. Throughput can go up or down, priorities can change, Epics/Features can grow significantly in scope and even deadlines change. It’s essential that you continuously reforecast (#ContinuousForecasting) as and when you get new information. Make sure you don’t just forecast once and for any forecasts you do, make sure you share them with a caveat or disclaimer (or even a watermark!).

You could of course take a higher percentile too. You might want to use the 95th percentile for your monte carlo simulation (72 stories) and epic size (25), which would mean only 2 Epics. You also can use it to help protect the team —there might be 26 Epics that stakeholders want want yet we know this is only at best 50% likely (104 stories / 4 stories in an Epic) — so let’s manage expectations from the outset.

Summary

A quick run through of the topic and what we’ve learnt:

  • Capacity planning can be made much simpler than current methods suggest. Most would say it needs everyone in a room and the team to estimate everything in the backlog — this is simply not true.

  • Just like in previous posts, this is an area we can cover probabilistically, rather than deterministically. There are a range of outcomes that could occur and we need to consider this in any approach.

  • A simple formula to do this very quick calculation:

  • How Many Stories (85%) / Epic Size = Capacity Plan

  • To calculate how many stories, run a monte carlo simulation and take your 85th percentile for number of stories.

  • To calculate Epic/Feature size, visualise the total number of stories within an Epic/Feature, against the date completed, plotting the different percentiles and take the 85th one.

  • Divide the two, and that’s you capacity plan for the number of right sized Epics or Features in your forecasted time horizon.

  • Make sure you continuously forecast, using new data to inform decisions, whilst avoiding playing Tetris with capacity planning

Could you see this working in your context? Or are you already using this as a practice? Reply in the comments to let me know your thoughts :)

Story Pointless (Part 3 of 3)

The final of this three-part series on moving away from Story Points and how to introduce empirical methods within your team(s). 

Part one refamiliarised ourselves with what story points are, a brief history lesson and facts about them, the pitfalls of using them and how we can use alternative methods for single item estimation. 

Part two looked at probabilistic vs. deterministic thinking, the use of burndown/burnups, the flaw of averages and monte carlo simulation for multiple item estimation.

Part three focuses on some common questions and challenges posed with these new methods, allowing you to handle those questions you may get asked when wanting to introduce a new approach in your teams/organisation.

The one question I get asked the most

Would you say story points have no place in Agile?

My personal preference is that just like Agile has evolved to be a ‘better way’ (in most contexts) than Waterfall, the methods described in this series are a ‘better way’ than using Story Points. Story Points make sense to be used in contexts where you have little or no dependencies and spend more time ‘doing’ than ‘waiting’.

Troy Magennis — What’s the Story About Agile Data

The problem is that so few teams in a large organisation like ours have this context yet have been made to “believe” story points are the right thing to do. For contexts like this, teams are much better off estimating the time they will spend ‘blocked’ or ‘waiting’, rather than the active time ‘doing’.

Common questions posed for single item estimation

But the value is in the conversation, isn’t that what story points are about?

Gaining a shared understanding of the work is most definitely important! The problem is that there are much better ways of understanding the problem you’re trying to solve than giving something a Fibonacci number and debating if something is a ‘2’ or a ‘3’ or why someone feels that way about a number. You don’t need a ‘number’ to have a conversation — don’t confuse estimation with analysis! The most effective way to learn and understand the problem is by doing the work itself. This method provides a much more effective approach in getting to that sooner than story points do.

Does this mean all stories are the same size?

No! This is a common misconception you may hear. What we care about is “right sizing” our items, meaning they are no larger than an agreed size. 

 This is derived by using the 85th (or the number of your choice!) percentile, as mentioned in part one.

What about task estimation?

Source

Not using tasks encourages collaboration, swarming and getting stories (rather than tasks) finished. It’s quite ironic that proponents of Scrum encourage sub tasks, yet one of the creators of Scrum (Jeff Sutherland) holds a different view, supported by data. In addition to this, Microsoft found that using estimates in hours had errors as large as ±400% of the estimate.

Should we not use working days and exclude weekends?

Whilst there is nothing to say excluding weekends is ‘bad’ — it again comes back to the principle of talking in the language of our customer. If we have a story that we say on 30th April 2021 has a 14-day cycle time at 85% likelihood — when is reasonable to expect it? It would be fair to say this is on or around 14th May.

Yet if we meant 14 working days this would be 21st May (due to the bank holiday) — which is a whole week extra! Actual days again makes it easier for our customers/stakeholders to understand as we’re talking in their language.

Do you find stakeholders accepting this? What options do you have when they don’t?

Stakeholders should (IMO) never *tell* a team how to estimate, as that is owned by the team. What I do communicate is the options they have on the likelihood. I would let them know 85% still has risk and if they want less risk (i.e., 90th/95th percentile) then it means a longer time, but the decision with risk is with them.

Why choose the 85th percentile?

The 85th percentile is common practice purely as it ‘feels right’. For most customers or stakeholders they’ll likely interpret this as “highly likely”, which will be good enough for them. Feel free to choose a higher percentile if you want less risk (but recognise it will be a longer duration!).

Common questions posed for multiple item estimation

Does this mean all stories are the same size?

No! See above.

Do we need to have lots of data for this?

Before considering how much data, the most important thing is stability of your system/process. For example if your work is highly seasonal, you might want to consider this in your input data to your forecast if the future work will be less ‘hectic’.

However, let’s get back to the question. You can get started with as little as three samples (three weeks or say three sprints worth) of data. The sweet spot is 7–15 samples, anything more than 15 and you’ll likely need to discard old data as it may negatively impact your forecasts.

With 5 samples we are confident that the median will fall inside the range of those 5 samples, so that already gives us an idea about our timing and we can make some simple projections.

(Source: Actionable Agile Metrics For Predictability)

With 11 samples we are confident that we know the whole range, as there is a 90% probability that every other sample will fall in that range.

(Source: German Tank Problem)

What if I don’t have any previous data?

Tools like the Excel sheet from Troy provide the ability to estimate your range in completed stories. Once you start the work, populate with your actual samples and change the spreadsheet to use ‘Data’ as an input.

What about if it’s a new technology/our team has changed?

Good question — throw away old data! Given you only need a few samples you should not let different contexts/team setups influence your forecast.

Should I do this at the beginning of my project/release and send to our stakeholders?

You should do it then and continue to doso as and when you get new samples, do not just do one forecast! Ensure you practice #ContinuousForecasting and caveat that any forecasts are a point in time based on current data. Remember, short term forecasts (i.e., a sprint) will be more accurate than longer ones (e.g., a year long forecast done at the start of a financial year).

What about alternative types of Monte Carlo Simulation? Markov chain etc.?

This is outside the scope of this article, but please check out this brilliant and thorough piece by Prateek Singh comparing the different types of Monte Carlo Simulation.

So does the opinion of individuals not matter?

Of course not :) These methods are just introducing an objective approach into that conversation, and getting us away from methods that can easily be manipulated by ‘group think’. Use it to inform your conversation, don’t just treat it as the answer.

Isn’t this more an “advanced” practice anyway? We’re pretty new to this way of working…

No! There is nothing in agile literature that says you have to start with story points (or Scrum/sprints for that matter), nor that you have to have been practicing other methods before this one. The problem with starting with methods such as story pointing is they are starting everyone off in a language no one understands. These other methods are not. In a world where unlearning and relearning is often the biggest factor in any adoption of new ways of working, I’d argue it’s our duty to make things easier for our people where we can. Speaking in a language they understand is key to that.

Conclusions

Story points != Agile. 

Any true Agilista should be wanting to stay true to the manifesto and always curious about uncovering better ways of working. Hopefully this series presents some fair challenges to traditional approaches but, more importantly, alternatives you can put into practice right away in your context.

Let me know in the comments if you liked this series, if it challenged you, anything you disagree with and/or any ways to make it even better.

— — — — — — — — — — — — — — — — — — — — — — — — — —

References for this series:

Story Pointless (Part 2 of 3)

The second in a three-part series on moving away from Story Points and how to introduce empirical methods within your team(s). 

Part one refamiliarised ourselves with what story points are, a brief history lesson and facts about them, the pitfalls of using them and how we can use alternative methods for single item estimation.

Part two looks at probabilistic vs. deterministic thinking, the use of burndown/burnups, the flaw of averages and monte carlo simulation for multiple item estimation.

Forecasting

You’ll have noticed in part one I used the word forecast a number of times, particularly when it came to the use of Cycle Time. It’s useful to clarify some meaning before we proceed.

What do we mean by a forecast?

Forecast — predict or estimate (a future event or trend).

What does a forecast consist of?

A forecast is a calculation about the future that includes both a range and a probability of that range occurring.

Where do we see forecasts?

Everywhere!

Sources: FiveThirtyEight & National Hurricane Centre

Forecasting in our context

In our context, we use forecasting to answer the key questions of:

  • When will it be done?

  • What will we get?

Which we typically do by:

Which we then visualize as a burnup/burndown chart, such as the example below. Feel free to play around with the inputs:

https://observablehq.com/embed/@nbrown/story-pointless?cells=viewof+work%2Cviewof+rate%2Cchart

All good right? Well not really…

The problems with this approach

The big issue with this approach is that the two inputs into our forecast(s) are highly uncertain, both are influenced by;

  • Additional work/rework

  • Feedback

  • Delivery team changes (increase/decrease)

  • Production issues

Neither inputs can be known exactlyupfront nor can they be simply taken as a single value, due to their variability.

And don’t forget the flaw of averages!

Plans based on average, fail on average (Sam L. Savage — The Flaw of Averages)

The above approach means forecasting using average velocity/throughput which, at best, is the odds of a coin toss!

Source:

Math with bad drawings — Why Not to Trust Statistics

Using averages as inputs to any forecasting is fraught with danger, in particular as it is not transparent to those consuming the information. If it was it would most likely lead to a different type of conversation:

But this is Agile — we can’t know exactly when something will be done!?!…

Source: Jon Smart — Sooner, Safer, Happier

Estimating when something will be done is particularly tricky in the world of software development. Our work predominantly sits in the domain of ‘Complex’ (using Cynefin) where there are “unknown unknowns”. Therefore, when someone asks, “when will it be done?” or “what will we get?” — when we estimate, we cannot give them a single date/number, as there are many factors to consider. As a result, you need to approach the question as one which is probabilistic (a range of possibilities) rather than deterministic (a single possibility).

Forecasts are about predicting the future, but we all know the future is uncertain. Uncertainty manifests itself as a multitude of possible outcomes for a given future event, which is what science calls probability.

To think probabilistically means to acknowledge that there is more than one possible future outcome which, for our context, this means using ranges, not absolutes.

Working with ranges

Communicating such a wide range to stakeholders is definitely not advisable nor is it helpful. In order to account for this, we need an approach that allows us to simulate lots of different scenarios.

The Monte Carlo method is a method of using statistical sampling to determine probabilities. Monte Carlo Simulation (MCS) is one implementation of the Monte Carlo method, where a real-world system is used to describe a probabilistic model. The model consists of uncertainties (probabilities) of inputs that get translated into uncertainties of outputs (results).

This model is run a large number (hundreds/thousands) of times resulting in many separate and independent outcomes, each representing a possible “future”. These results are then visualised into a probability distribution of possible outcomes, typically in a histogram.

TLDR; this is getting nerdy so please simplify

We use ranges (not absolutes) as inputs in the amount of work and the rate we do work. We run lots of different simulations to account for different outcomes (as we are using ranges).

So instead of this:

https://observablehq.com/embed/@nbrown/story-pointless?cells=viewof+work%2Cviewof+rate%2Cchart

We do this:

https://observablehq.com/embed/@nbrown/story-pointless?cells=chart2%2Cviewof+numberOfResultsToShow%2Cviewof+paceRange%2Cviewof+workRange

However, this is not easy on the eye! 

So what we then do is visualise the results on a Histogram, showing the distribution of the different outcomes.

We can then attribute percentiles (aka a probability of that outcome occurring) to the information. This allows us to present a range of outcomes and probability of those outcomes occurring, otherwise known as a forecast.

Meaning we can then move to conversations like this:

The exact same approach can be applied if we had a deadline we were working towards and we wanted to know “what will we get?” or “how far down the backlog will we get to”. The input to the forecast becomes the number of weeks you have, with the distribution showing the percentage likelihood against the number of items to be completed.

Tools to use

Clearly these simulations need computer input to help them be executed. Fortunately there are a number of tools out there to help:

  • Throughput Forecaster — a free and simple to use Excel/Google Sheets solution from troy.magennis that will do 500 simulations based on manual entry of data into a few fields. Probably the easiest and quickest way to get started, just make sure you have your Throughput and Backlog Size data.

  • Actionable Agile — a paid tool for flow metrics and forecasting that works as standalone SaaS solution or integrated within Jira or Azure DevOps. This tool can do up to 1 million simulations, plus gives a nice visual calendar date for the forecasts and percentage likelihood.

Source:

Actionable Agile Demo

  • FlowViz — a free Power BI template that I created for teams using Azure DevOps and GitHub Issues that generates flow metrics as well as monte carlo simulations. The histogram visual provides a legend which can be matched against a percentage likelihood.

Summary — multiple item forecasting

  • A forecast is a calculation about the future that includes both a range and a probability of that range occurring

  • Typically, we forecast using single values/averages — which is highly risky (odds of a coin toss at best)

  • Forecasting in the complex domain (Cynefin) needs to account for uncertainty (which using ‘average’ does not)

  • Any forecasts therefore need to be probabilistic (a range of possibilities) not deterministic (a single possibility)

  • Probabilistic Forecasting means running Monte Carlo Simulations (MCS) — simulating the future lots of different times

  • To do Monte Carlo simulation, we need Throughput data (number of completed items) and either a total number of items (backlog size) or a date we’re working towards

  • We should always continuously forecast as we get new information/learning, rather than forecasting just once

Ok but what about…

I’m sure you have lots of questions, as did I when first uncovering these approaches. To help you out I’ve collated the most frequently asked questions I get, which you can check out in part three

— — — — — — — — — — — — — — — — — — — — — — — — — —

References:

Story Pointless (Part 1 of 3)

The first in a three-part series on moving away from Story Points and how to introduce empirical methods within your team(s).

Part one refamiliarises ourselves with what story points are, a brief history lesson and facts about them, the pitfalls of using them and how we can use alternative methods for single item estimation.

What are story points?

Story points are a unit of measure for expressing an estimate of the overall effort (or some may say, complexity) that will be required to fully implement a product backlog item (PBI), user story or any other piece of work.

When we estimate with story points, we assign a point value to each item. Typically, teams will use a Fibonacci or Fibonacci-esque scale of 1,2,3,5,8,13,21, etc. Teams will often roll these points up as a means of measuring velocity (the sum of points for items completed that iteration) and/or planning using capacity (the number of points we can fit in an iteration).

Why do we use them?

There are many reasons why story points seem like a good idea:

  • The relative approach takes away the ‘date commitment’ aspect

  • It is quicker (and cheaper) than traditional estimation

  • It encourages collaboration and cross-functional behaviour

  • You cannot use them to compare teams — thus you should be unable to use ‘velocity’ as a weapon

A brief history lesson

Some things you might not know about story points:

Ron’s current thoughts on the topic

  • Story points are not (and never have been) mentioned in the Scrum Guide or viewed as mandatory as a part of Scrum

  • Story points originated from eXtreme Programming (XP)

  • - Chrysler Comprehensive Compensation (C3) project was the birth of XP

  • - They originally estimated in “ideal days” and later, unitless Story Points

  • - Ron Jeffries is credited with being the person who introduced them

  • James Grenning invented Planning Poker which was first publicised in Mike Cohn’s book Agile Estimating and Planning

  • Mountain Goat Software (Mike Cohn) own the trademark on planning poker cards and the copyright on the number sequence used for story point estimation

Problems with story points

What time would you tell your 

 friends you’d meet them?

They do not speak in the language of our customer

Telling our customers and stakeholders something is a “2” or a “3” does not help when it comes to new ways of working. What if we did this in other industries — what would you think as a customer? Would you be happy?

They may encourage the right behaviours, but also the wrong ones too

Agileis all about collaboration, iterative execution, customer value, and experimentation. Teams can have ‘high velocity’ but be finishing everything on the last day of the sprint (not working at a sustainable pace/mini waterfalls) and/or be delivering the wrong things (build the wrong thing). Similarly, teams are pressured to ‘increase velocity’ which is easy to artificially inflate by making every 2 into a 3, 3 into a 5, etc. — then we have increased our velocity!

They are hugely inconsistent within a team

Plot the actual time from starting to finishing an item (in days) against the story point estimate. Compare the variance for stories that had the same points estimate:

For this team (in Nationwide) we can see:

  • 1 point story — 1–59 days

  • 2 point story — 1–128 days

  • 3 point story — 1–442 days

  • 5 point story — 2–98 days

  • 8 point story — 1–93 days

They are a poor mechanism for planning / full of assumptions

Not only is velocity a highly volatile metric but it also encourages playing ‘Tetris’ with people in complex work. When estimating stories, teams purely take the story and acceptance criteria as written. They do not account for various assumptions (customer availability, platform reliability) and/or things that can go wrong or distract them (what is our WIP, discovery, refinement, production issues, bug-fixes, etc.) during an iteration.

Uncovering better ways

Agile has always been about “uncovering better ways”, after all it’s the first line of the Manifesto!

Given the limitations with story points, we should be open to exploring alternative approaches. When looking at uncovering new approaches, we need to be able to:

  • Forecast/Estimate a single item (PBI/User Story)

  • Forecast/Estimate our capacity at a sprint level (Sprint Backlog)

  • Forecast/Estimate our capacity at a release level (Release Backlog)

Source: Jon Smart — Sooner, Safer, Happier

Estimating when something will be done is particularly tricky in the world of software development. Our work predominantly sits in the domain of ‘Complex’ (using Cynefin) where there are “unknown unknowns”. Therefore, when someone asks, “when will it be done?” or “what will we get?” — we cannot estimate give them a single date/number, as there are many factors to consider. As a result, you need to approach the question as one which is probabilistic (a range of possibilities) rather than deterministic (a single possibility).

Forecasts are about predicting the future, but we all know the future is uncertain. Uncertainty manifests itself as a multitude of possible outcomes for a given future event, which is what science calls probability.

To think probabilistically means to acknowledge that there is more than one possible future outcome which, for our context, this means using ranges, not absolutes.

Single item forecast/estimation

One of the two key flow metrics that inputs into single item estimation is our Cycle Time. Cycle time is the amount of elapsed time between when a work item started and when a work item finished. We visualise this on a scatter plot, like so:

On the scatter plot, each ‘dot’ represents a PBI/user story, plotted against the completion date and the time (in days) it took to complete. Our 85th percentile (highlighted in the visual) tells us that 85% of our stories are completed within n days or less. Therefore with this team, we can say that 85% of the time we finish stories in 26 days or less.

We can communicate this to customers and stakeholders by saying that:

“If we start work on this today, there is an 85% chance it will be done in 26 days or less”

This may be sufficient for your customer (if so — great!), however they may push for it sooner. If, for instance, with this team they wanted the story in 7 days, you can show them (with data) that this is only 50% likely. Use this as a basis to start the conversation with them (and the rest of the team!) around breaking work down.

What about when work commences?

If they are happy with the forecast, and we start work on an item, it’s important that we don’t stop there and ensure we continue to manage the expectations of the customer.

Work Item Age is the second metric to use to maintain a continued focus on flow. This is the amount of time (in days) between when a item started and the current time. This applies only to items that are still in progress.

Each dot represents a user story and the age (in days) of that respective PBI/user story so far.

Use this in the Daily Scrum to track the age of an item against your 85th percentile time, as well as comparing to where an item is in your process.

If it is in danger of ‘breaching’ the cycle time, swarm on an item or break it down accordingly. If this can’t be done, work with your stakeholder(s) to collaborate on how to achieve the best outcome.

As a Scrum Master / Agile Delivery Manager / Coach, your role would be to guide the team in understanding the trade offs of high WIP age items vs. those closest to done vs. starting something new — no easy task!

Summary — Single Item Forecasting

In terms of a story pointless approach to estimating a single item, try the following:

  1. Prioritise your backlog

  2. Use your Cycle Time scatter plot and 85th percentile

  3. Take the next highest priority item on your backlog

  4. As a team, ask — “Do we think this can be delivered within our 85th percentile?”

  5. (Note: you can probe further and ask ‘can this be delivered within our 50th percentile?” to promote further slicing/refinement)

  6. If yes, then let’s get started/move it to ‘Ready’ 

  7. (considering your work-in-progress)

  8. If no, then find out why/break it down till it is small enough

  9. Once we start work on items, use Work Item Age as a leading indicator for flow

  10. Manage Work Item Age as part of your Daily Scrum, if it looks like it may exceed the 85th percentile — swarm/slice!

Please note: it’s best to familiarise yourself with what your 85th percentile is first (particularly in comparison to your cadence). 

If it’s 100+ days then you should be focusing initially on reducing that time — this can be done through various means such as pairing, mobbing, story mapping, story slicing, lowering WIP, etc.

But what about for multiple items? And what about…

For multiple item forecasting, be sure to check out part two.

If you have any questions, feel free to add them to the comments below in time for part three, which will cover common questions/observations people make about these new methods…

— — — — — — — — — — — — — — — — — — — — — — — — — —

References:

ThoughtSpot and Blocked Work

The Importance of Being Blocked

Despite our best attempts at creating small, cross-functional and autonomous teams, being “blocked” is unfortunately still a common occurrence with many teams. There can be any number of reasons why work gets blocked — it could be internal to the team (e.g. waiting on Product Owner/Manager feedback, environments down, etc.), within the technology function/from other teams (e.g. platform outage) or even the wider organisation (e.g. waiting for risk, security, legal, etc.).

The original production of The Importance of Being Earnest in 1895…with a blocked lens

Source: Wikipedia

As mentioned in a previous post, flow metrics should be an essential aspect in the day to day interactions a high performing team has. They should also be leveraged as inputs into conversations with stakeholders, whether it’s them being interested in the product(s) the team is building and/or as members in the technology ecosystem in the organisation.

Unfortunately, when it comes to flow, measuring and quantifying blocked work is one of the biggest blind spots teams have. Most teams probably don’t have a consensus on what being blocked means — As Dan Vacanti and Prateek Singh mentioned in their video on Flow Efficiency, most teams don’t even have an agreement on a definition of what blocked is!

Source:

https://stefan-willuda.medium.com/being-blocked-it-s-not-what-you-might-think-f8b3ad47e806

Blocked work is probably one of the most valuable data insights at your disposal as a team and organisation. These are the real things that are actually slowing you down, and likely the biggest impediments to flow that are in your in your way. As Jonathan Smart would say in Sooner Safer Happier:

Impediments are not in the path. Impediments ARE the path.

So how can we start to make this information visible and quantify the impact of our work being blocked? We use Blocked Work metrics.

Blocked Work Metrics

Here are four recommended metrics to look at when it comes to measuring the impact of work being blocked:

  • Current Blocked Items — items that are currently blocked and how long they have been blocked for.

  • Blocker Frequency — how frequently items become blocked, as well as a trend line showing if this is becoming more/less frequent over time.

  • Mean Time To Unblocked (MTTU)— how long (on average) does it take to unblock items, as well as a trend line to show if this is decreasing over time.

  • Days Lost to Being Blocked — how many days of an item’s total cycle time were spent being blocked (compared to not blocked).

Generating these in ThoughtSpot

As mentioned in previous posts, ThoughtSpot is what we use for generating insights on different aspects of work in Nationwide, one of the key products offered by our Measurement & Insight Accelerator. It produces ‘answers’ from our data which are then pinned to ‘pinboards’ for others to view. Our Product Owner Marc Price, supported by Zsolt Berend showcase this across the organisation, demonstrating how it aids conversations and learning, as opposed to a tool for senior leaders to brandish as a stick!

The Blocked Work Insights Pinboard is there as a pinboard for teams to ‘pull’ (rather than forced to use) — editing/filtering to be relevant to their context.

Using Blocked Work Insights

Current Blocked Items

This chart can be used as an input to your Daily Scrum. Discuss as a team on how to focus or swarm on unblocking these items over starting new work, particularly those that have been blocked for an extended period and/or may be closer to “Done” in your context.

Blocker Frequency

In using this chart, you should look at the trendline and the direction it’s heading, as well as the frequency of work being blocked. From a trend perspective it should be trending downwards or low and stable. If it’s trending in the wrong direction (upwards) then use this as an input into Retrospectives — potentially focusing on reducing dependencies the team faces.

Mean Time to Unblocked (MTTU)

Use this chart to see how long it takes blockers to be resolved, as well as if this time to resolve is improving (trend line heading downward) or getting worse (trend line going upward) over time.

Days Lost to Being Blocked

Use this chart to identify how much time is being lost due to work being blocked, potentially identifying themes around why items are blocked. You could use this as part of a a blocker clustering exercise in a retrospective. If you find the blockers are due to external factors, use it with senior leaders who can influence external change to show them the quantified impact teams are facing due to external bottlenecks.

Summary

To summarise, focusing on blocked work is data that is overlooked by most Agile teams. It shouldn’t be, as it will likely give you clear insight into where the bottlenecks are in achieving flow in your system, and the most impact with the improvements you identify. Teams should leverage data and metrics such as Current Blocked Items, Blocker Frequency, Blocked Vs. Unblocked and Time Lost to Being Blocked in order to take a data-driven approach to system-wide improvement.

For any Nationwide folks reading this who are curious about the impact of blocked work in their context, be sure to check out the Blocked Work Insights pinboard on our ThoughtSpot platform.

What metrics do you use for blocked work? Let me know in the replies :)

Thoughtspot and the four flow metrics

Focusing on flow

As a Ways of Working Enablement Specialist, one of our primary focuses is on flow. Flow can be referred to as the movement of value throughout your product development system. Some of the most common methods teams will use in their day to day are Scrum, Kanban, or Scrum with Kanban.

Optimising flow in a Scrum context requires defining what flow means. Scrum is founded on empirical process control theory, or empiricism. Key to empirical process control is the frequency of the transparency, inspection, and adaptation cycle — which we can also describe as the Cycle Time through the feedback loop.

Kanban can be defined as a strategy for optimising the flow of value through a process that uses a visual, work-in-progress limited pull system. Combining these two in a Scrum with Kanban context means providing a focus on improving the flow through the feedback loop; optimising transparency and the frequency of inspection and adaptation for both the product and the process.

Quite often, product teams will think that the use of a Kanban board alone is a way to improve flow, after all that is one of its primary focuses as a method. Taking this further, many Scrum teams will also proclaim that “we do Scrum with Kanban” or “we like to use ScrumBan” without understanding what this means if you really do focus on flow in the context of Scrum. However, this often becomes akin to pouring dressing all over your freshly made salad, then claiming to eat healthily!

Images via

Idearoom

/

Adam Luck

/

Scrum Master Stances

If I was to be more direct, put simply, Scrum using a Kanban board ≠ Scrum with Kanban.

All these methods have a key focus on empiricism and flow — therefore visualisation and measurement of flow metrics is essential, particularly when incorporating these into the relevant events in a Scrum context.

The four flow metrics

There are four basic metrics of flow that teams need to track:

  • Throughput — the number of work items finished per unit of time.

  • Work in Progress (WIP) — the number of work items started but not finished. The team can use the WIP metric to provide transparency about their progress towards reducing their WIP and improving their flow.

  • Cycle Time — the amount of elapsed time between when a work item starts and when a work item finishes.

  • Work Item Age — the amount of time between when a work item started and the current time. This applies only to items that are still in progress.

Generating these in ThoughtSpot

ThoughtSpot is what we use for generating insights on different aspects of work in Nationwide, one of the key products offered to the rest of the organisation by Marc Price and Zsolt Berend from our Measurement & Insight Accelerator. This can be as low level as individual product teams, or as high-level as aggregated into our different Member Missions. We produce ‘answers’ from our data which are then pinned to ‘pinboards’ for others to view.

Our four flow metrics are there as a pinboard for teams to consume, filtering to their details/context and viewing the charts. If they want to, they can then pin these to their own pinboards for sharing with others.

For visualizing the data, we use the following:

  • Throughput — a line chart for the number of items finished per unit of time.

  • WIP — a line chart with the number of items in progress on a given date.

  • Cycle Time — a scatter plot where each dot is an item plotted against how long it took (in days) and the completed date. Supported by an 85th percentile below showing how long in days items took to complete.

  • Work Item Age — a scatter plot where each dot is an item plotted against its current column on the board and how long it has been there. Supported by the average age of WIP in the system.

Using these in Scrum Events

Throughput (Sprint Planning, Review & Retrospective) — Teams can use this as part of Sprint Planning in forecasting the number of items for the Sprint Backlog.

It can also surface in Sprint Reviews when it comes to discussing release forecasts or product roadmaps (although I would encourage the use of Monte Carlo simulations in this context — more in a later blog on this). As well as being reviewed in the Sprint Retrospective, where teams inspect and adapting their processes to find ways to improve (or validating if previous experiments have improved) throughput.

Work In Progress (Daily Scrum & Sprint Retrospective) — as the Daily Scrum focuses on what’s currently happening in the sprint/with the work, WIP chart is good to look at here (potentially seeing if it’s too high).

The chart also is a great input into the Sprint Retrospective, particularly seeing where WIP is trending towards — if teams are optimising their WIP then you would expect this to be relatively stable/low — if high/highly volatile then you need to “stop starting and start finishing” or find ways you can improve your workflow.

Cycle Time (Sprint Planning, Review & Retrospective) — Looking at 85th/95th percentiles of Cycle Time can be a useful input into deciding what items to take into the Sprint Backlog. Can we deliver this within our 85th percentile time? If not, can we break it down? If we can, then let’s add it to the backlog. It also works as an estimation technique, so stakeholders know that when work is started on an item, there is an 85% likelihood it will take n days — want it in n days? Ok well that’s only got a 50% likelihood, can we collaborate to break it down into something smaller? Then let’s add that to a backlog refinement discussion.

In the Sprint Review it can be used by looking at trends, such as if your cycle times are highly varied then are there larger constraints in the “system” that we need stakeholders to help with? Finally, it provides a great discussion point for Retrospectives — we can use it to deep dive into outliers to find out what happened and how to improve, see if there is a big difference in our 50th/85th percentiles (and how to reduce this gap), and/or see if the improvements we have implemented as outcomes of previous discussions are having a positive impact on cycle time.

Work Item Age (Sprint Planning & Daily Scrum) — this is a significantly underutilised chart that so many teams could get benefit from. If you incorporate this into your Daily Scrums, it will likely lead to much more conversations on getting work done (due to item age) rather than generic updates. Compare work item age to your 85th percentile on your cycle time — is it likely to exceed this time? 

 Is that ok? Should we/can slice it down further to get some value out there and faster feedback sooner? All very good, flow-based insights this chart can provide.

It may also play a part in Sprint Planning — do you have items left over from the previous sprint? What should we do with those? All good inputs into the planning conversation.

Summary

To summarise, focusing on flow involves more than just using a Kanban board to visualize your work. To really take a flow-based approach and incorporate the foundations of optimising WIP and empiricism, teams should utilise the four key flow metrics of Throughput, WIP, Cycle Time and Work Item Age. If you’re using these in the context of Scrum, look to accommodate these appropriately into the different Scrum events.

For those wanting to experiment with these concepts in a safe space, I recommend checking out TWiG — the work in progress game, (which now has a handy facilitator and participant guide) and for any Nationwide folks reading this curious about flow in their context, be sure to check out the Four Key Flow Metrics pinboard on our ThoughtSpot platform.

Further/recommended reading:

Kanban Guide (Dec 2020 Edition) — KanbanGuides.org

Kanban Guide for Scrum Teams (Jan 2021 Edition) — Scrum.org

Basic Metrics of Flow — Dan Vacanti & Prateek Singh

Four Key Flow Metrics and how to use them in Scrum events — Yuval Yeret

TWiG — The Work In Progress Game

Weeknotes #40

Product Management Training

This week we had a run through from Rachel of our new Product Management training course that she has put together for our budding Product Managers. I really enjoyed going through it as a team (especially using our co-working space in More London) and viewing the actual content itself.

Credits: Jon Greatbatch for photo “This can be for your weeknotes”

What I really liked about the course was the fact the attendees are going to be very ‘hands-on’ during the training, and will get to go apply various techniques that PdM’s use with a case study of Delete My Data (DMD) throughout. It’s something that I’ve struggled with when putting together material in the past of having an ‘incremental’ case study that builds through the day, so glad that Rachel has put something like this together. We’ve earmarked the 28th Jan to be the first session we run, with it being a combination of our own team and those moving into Product Management being the ‘guinea pigs’ for the first session.

2019 Reflections

This week has been a particularly challenging week, with lots of roadblocks in the way of moving forward. A lack of alignment in new teams with future direction, and lack of communication to the wider function around our move to new ways of working means that it feels like we aren’t seeing the progress we should be, or creating a sense of urgency. Whilst it’s certainly true around achieving big through small, it does feel that with change initiatives it can feel like you are moving too slow, which is the current lull we’re in. After a few days feeling quite down I took some time out to reflect on 2019, and what we have achieved, such as:

  • Delivering a combined 49 training courses on Agile, Lean and Azure DevOps

  • Trained a total of 789 PwC staff across three continents

  • Becoming authorised trainers to offer an industry recognised course

  • Actually building our first, proper CI/CD web apps as PoC’s

  • Introducing automated security tools and (nearly) setting up ServiceNow change management integration to #TakeAwayTheExcuses for not adopting Agile

  • Hiring our first ever Product Manager (Shout out Rachel)

  • Getting our first ever Agile Delivery Manager seconded over from Consulting (Shout out Stefano)

  • Our team winning a UK IT Award for Making A Difference

  • Agreement from leadership on moving from Project to Product, as part of our adoption of new ways of working

All in all, it’s fair to say we’ve made big strides forward this year, I just hope the momentum continues into 2020. A big thank you from me goes to Jon, Marie, James, Dan, Andy, Rachel and Stefano for not just their hard work, but for being constant sources of inspiration throughout the year.

Xmas Break

Finally, I’ll be taking a break from writing these #Weeknotes till the new year. Even though I’ll be working over the Christmas period, I don’t think there’ll be too much activity to write about! For anyone still reading this far in(!), have a great Christmas and New Year.

Weeknotes #39

Agile not WAgile

This week we’ve been reviewing a number of our projects that are tagged as being delivered using Agile ways of working within our main delivery portfolio. Whilst we ultimately do want to shift from project to product, we recognise that right now we’re still doing a lot of ‘project-y’ style of delivery, and that this will never completely go away. So we’re trying to in parallel at least get people familiar with what Agile delivery is all about, even if delivering from a project perspective.

The catalyst really for this was one of our charts where we look at the work being started and the split between which of that is Agile (blue line) Vs. Waterfall (orange line).

The aspiration being of course that with a strategic goal to be ‘agile by default’ the chart should indeed look something like it does here, with the orange line only slightly creeping up when needed but generally people looking to adopt Agile as much as they can.

When I saw the chart looking like the above last week I must admit, I got suspicious! I felt that we definitely were not noticing the changes in behaviours, mindset and outcomes that the chart would suggest, which prompted a more thorough review.

The review was not intended to act as the Agile police(!), as we very much want to help people in moving to new ways of working, but to really make sure people had understood correctly around what Agile at its core really is about, and if they are indeed doing that as part of their projects.

The review is still ongoing, but currently it looks like so (changing the waterfall/agile field retrospectively updates the chart):

The main problems observed being things such as lack of frequent delivery, with project teams still doing one big deployment to production at the end before going ‘live’ (but lots of deployments to test environments). Projects are maybe using tools such as Azure DevOps and some form of Agile events (maybe daily scrums), but work is still being delivered in phases (Dev / Test / UAT / Live). As well as this, a common theme was not getting early feedback and changing direction/priorities based on that (hardly a surprise if you are infrequently getting stuff into production!).

Inspired by the Agile BS detector from the US Department of Defense, I prepared a one-pager to help people quickly understand if their application of Agile to their projects is right, or if they need to rethink their approach:

Here’s hoping the blue line goes up, but against some of that criteria above, or at least we get more people approaching us for help in how to get there.

Team Health Check

This week we had our sprint review for the project our grads are working on, helping develop a team health check web app for teams to conduct monthly self assessments as to different areas of team needs and ways of working.

Again, I was blown away by what the team had managed to achieve this sprint. Not only had they managed to go from a very basic, black and white version of the app to a fully PwC branded version.

They’ve also successfully worked with Dave (aka DevOps Dave) to configure a full CI/CD pipeline for any future changes made. As the PO for the project I’ll now be in control of any future releases via the release gate in Azure DevOps, very impressive stuff! Hopefully now we can share more widely and get teams using it.

Next Week

Next week will be the last weeknotes for a few weeks, whilst we all recharge and eat lots over Christmas. Looking at finalising training for the new year and getting a run through from Rachel in our team of our new Product Management course!

Weeknotes #38

Authorized Instructors

This week, we had our formal course accreditation session with ICAgile, where we were to review our 2-day ICAgile Fundamentals course, validating if it meets the desired learning objectives as well as the general course structure, with the aim being to sufficiently balance theory, practical application and attendee engagement. I was extremely pleased when we were given the rubber stamp of approval by ICAgile, as well as getting some really useful feedback to make the course even better, in particular to include more modules aligned to the training from the BACK of the room (TBR) technique.

It’s a bit of a major milestone for us as a team, when you consider this time last year most of the training we were doing was just starting, and most of the team running it for the first time. It’s testimony to the experience we’ve gained, and incremental improvements we’ve made based on the feedback we’ve received that four of us are now authorized to offer a certified course from a recognised body in the industry. A new challenge we face in the course delivery is now the organisational impediments faced around booking meeting rooms(!) — but with two sessions in the diary for January and February next year I’m looking forward to some more in depth learning and upskilling for our PwC staff.

Product Management

As I mentioned last week, Rach Fitton has recently joined us as a Product Manager, looking to build that capability across our teams. It’s amazing how quickly someone with the right experience and mindset can quickly make an impact, as I already feel like myself (and others) are learning a great deal from her. Despite some conversations with colleagues so far where I feel they haven’t given her much to work with, she’s always given them at least one thing that can inspire them or move them further along on the journey. 

A good example being the visual below as something she shared with myself and others around all the activities and considerations that a Product Manager typically would undertake:

Things like this are great sources of information for people, as it really emphasises for me just how key this role is going to be in our organisation. It’s great for me to have someone far more experienced in the product space than myself to not only validate my thoughts, but also critique any of the work we do, as Rachel gives great, actionable feedback. I’m hoping soon we can start to get “in the work” with more of the teams and start getting some of our people more comfortable with the areas above.

Next Week

Next week we plan to start looking at structuring one of our new services and the respective product teams within that, aiming for a launch in the new year. I’m also looking forward to connecting with those in the PwC Sweden team, who are starting their own journey towards new ways of working. Looking forward to collaborating together on another project to product journey.

Weeknotes #37

Ways of Working

This week we had our second sprint review as part of our Ways of Working (WoW) group. The review went well with lots of discussion and feedback which, given we aren’t producing any “working software” is for me a really good sign. We focused a lot on change engagement this sprint, working on the comms side as well (with producing ‘potentially releasable comms’) as well as identifying/analysing our pilot areas where we really want teams to start to move towards this approach. A common theme appears to be around the lack of a product lens to services being offered, and a lack of portfolio management to ensure WIP is being managed and work aligns with strategy. If we can start to tackle this then we should have some good social proof for those who may be finding adoption slightly more tricky.

We agreed to limit our pilot to be on four particular areas for now, rather than spreading ourselves too thinly across multiple teams, fingers crossed we can start to have some impact this side of the new year.

New Joiners

I was very pleased this week to finally have Rachel, our new Product Manager finally join us. It feels like an age since we interviewed her for the role, and we’ve been trying our best in holding people back to make sure we aren’t veering too much away from the Product Management capability we’re wanting her to build. It’s great to have someone who is a very experienced practitioner, rather than have someone who just relies on the theory. I often find that the war stories and when stuff has not quite worked out is where the most learning occurs, so it’s great to have her here in the team to help us all.

Another positive note for me was after walking her through the WoW approach, as she not only fed back around it making sense but that it also has her excited :) It’s always nice to get some validation from a fresh pair of eyes, particularly from someone as experienced as Rachel is, I’m really looking forward to working with and learning from her.

With Rachel joining us as a Product Manager, and Dave who joined us roughly a month ago as a DevOps Engineer, it does feel like we’re turning a corner in the way we’re recruiting as well as the moves towards new ways of working day to day. I’m extremely appreciative to both of them for taking a risk in wanting to be part of something that will be both very challenging but also (hopefully!) very rewarding.

Team Health Check

We’ve made some good progress this week with our Team Health Check App, which will help teams identify different areas of their ways of working which may need improvement. With a SQL DB now populated with previous results, we can actually connect to a source where the data will be automatically updated, as opposed to manually copying/pasting from Google Sheets -> Power BI. The next step is to get it fully working in prod with a nicer front end, release it to some users to actually use, as well as write a short guidance document on how to connect to it.

Well done again to all our grads for taking this on as their first Agile delivery, they’re definitely learning as they go but thankfully taking each challenge/setback as a positive. Fingers crossed for the sprint review Thursday it’s something we can release!

Next Week

Next week we have our ICAgile course accreditation session, hopefully giving us the rubber stamp as accredited trainers to start offering our 2-day ICAgile Fundamentals course. It also means another trip to Manchester for myself, running what I *think* will be my last training session of 2019. Looking forward to delivering the training with Andy from our team for our people in Assurance!

Weeknotes 36

Refreshing Mindsets

This week was the second week of our first sprint working with our graduate intake on our team health check web app. It was great to see in the past week or so that the team, despite not having much of a technical background, had gone away and been able to create a very small app created using a mix of Python and an Azure SQL database for the responses. It just goes to show how taking the work to a team and allowing them to work in an environment where they can be creative (rather than prescribing the ‘how’) can lead to a great outcome. Whilst the app is still not quite yet in a ‘releasable’ state, in just a short time it really isn’t too far away from something a larger group of Agile Delivery Managers and Coaches can use. It’s refreshing to not have to take on the battle of convincing hearts and minds, working with a group of people who recognise this is the right way to work and are just happy to get on and deliver. Thanks to all of them for their efforts so far!

Cargo Culting

“Cargo Culting” is a term used when people believe they can achieve benefits by adopting/copying certain behaviours, actions or techniques. They don’t consider why the benefits and/or causes occur, instead just blindly copy the behaviours to try get similar results.

In the agile world, this is becoming increasingly commonplace, with the Spotify model being the latest fad for cargo culting in organisations. Organisations are hearing about how Spotify or companies like ING are scaling Agile ways of working which, in practice, sounds great, but it is incredibly hard and nowhere near as simple as just redesigning organisations into squads, tribes, chapters and guilds.

In a training session with some of our client facing teams this week, I used the above as an example of what cargo culting is like. Experienced practitioners need to be aware that the Spotify model is one tool in the toolbox, with there being lots of possible paths to organisational agility. Spotify themselves never referred to it as a model, nor use it themselves anymore, as well as ING moving towards experimenting with using LeSS in addition to the Spotify model. Dogma is one of the worst traps you can fall into when it comes to moving to new ways of working, particularly when you don’t stop and reassess whether this actually is the right way for this context. Alignment on language is important, but should not be at the compromise of finding first of all what works in the environment.

Next Week

Next week I’ll be running an Agile Foundations training session, and we (finally!) have Rachel joining our team as a Product Manager. I’m super excited to have her as part of the team, whilst hopeful we can control the flow of requests her way so she does not feel swamped, looking forward to having her join PwC!

Weeknotes #35

Back to Dubai

This week I was out in the Middle East again, running back to back Agile Foundations training sessions for people in our PwC Middle East firm. 

I had lots of fun, and it looked like attendees did too, both with the engagement on the day and the course feedback I received.

One issue with running training sessions in a firm like ours are that a number of large meeting rooms still have that legacy “boardroom” format, which means for little movement during sessions that require interaction. Last time I was there this wasn’t always the case, as one room was in the academy which, as you can tell by the title was a bit more conducive to collaboration. As well as that we had 12 people attend on day one, but 14 attendees on day two which again for me is probably two people too many. Whilst it generally works ok in the earlier parts of the day as the room can break off into two groups, it causes quite a lot of chaos when it comes to the lego4scrum simulation later on, as we really only have enough lego for one group. Combine that with the room layout and you can understand why some people can go off and get distracted/talk amongst themselves, but then again maybe that’s a challenge for the Scrum Master in the simulation! A learning for me is to limit it to 12 attendees max, with a preference to smaller (8–10) audience sizes.

Retrospectives

I’ve talked before around my view on retrospectives, and how they can be mistreated by those who act as the ‘agile police’ by using their occurance to determine if a team is/is not Agile (i.e. “thou cannot be agile if thou is not running retrospectives”). This week we’ve had some further contact from our Continuous Improvement Group around the topic and how to encourage more people to conduct them. Now, given this initiative has been going on for some time, I feel that we’ve done enough around encouragement and providing assistance/coaching to people if needed. We’ve run mock retrospectives, put together lengthy guidance documents with templates/tools for people to use, people practice it in the training on multiple occasions yet there are still only a small amount of people doing them. Given a key principle we have is invitation over infliction, this highlights that the interest isn’t currently there, and that’s ok! This is one in a list of many ‘invitations’ there are for people to start their agile journey — if the invitation is not accepted then ok, let’s try a different aspect of Agile.

A more important point for me really is that just because you are having retrospectives, it does not always mean you are continuously improving.

If it’s a moan every 1–4 weeks, that’s not continuous improvement. 

If nothing actionable or measurable comes out of it that is then reviewed at the next retro, then it’s not continuous improvement. 

If it’s held too infrequently, then it’s not continuous improvement.

With Toyota’s Kentucky factory pulling on the andon cord on average 5,000 times a day, this is what continuous improvement is! Worth all of us as practitioners remembering that running a retrospective ≠ Continuous Improvement.

Next Week

Next week we have a review with ICAgile, to gain course accreditation to start offering a 2-day training course with a formal ICAgile Fundamentals certification. It’s been interesting putting the course together and mapping it to official learning outcomes to validate attendees getting the certification. Fingers crossed all goes well and we can run a session before Christmas!

Weeknotes #34

Team Areas

A tell tale sign for any Agile practitioner is normally a walk of the office floor. If an organisation claims to have Agile teams, usually a giveaway is if there are team areas with lots of visual radiators around their ways of working.

With my trip to Manchester this week, I was really please to see that one of our teams, Vulcan had taken to claiming their own area and making the work they do and the management of it highly visible.

This is great to see as even with the digital tooling we have, it’s important for teams (within a large organisation) to have a sense of purpose and identity, which I’d argue is impossible to do without something physical/a dedicated area for their work. These are the things that when going through change provide inspiration and encourage you to keep on going, knowing that certainly with some teams, the message is landing.

Product Manager Hat

With our new graduate intake in IT, one of the things various teams were asked to put together was a list of potential projects for them to work on. 

A niggling issue I’ve had is our Team Health Check tool which, taking inspiration from the Spotify Squad Health Check, uses a combination of anonymous Google Form responses that are then visualized in Power BI.

This process though is highly manual, with a Google Apps Script converting the form responses into a BI tool friendly format, then copied/pasted into a Power BI table. The project therefore for the graduates is about a web version, with a database to store responses for automated reporting. I’ve therefore been volunteered as the Product Manager :D which meant this week even writing some stories and BDD acceptance criteria! Looking forward to seeing how creative they can be, and a chance for them to really apply some of the learnings from the recent training they’ve been through.

Digital Accelerator Feedback

We received feedback from both our Digital Accelerator sessions we ran recently. Overall with an average score of 4.43/5 we were one of the highest rated sessions people attended. We actually received the first batch of feedback before the second session, which was great for us as it allowed us to make a couple tweaks to exercises and delete slides that we feel maybe weren’t needed. Some highlights in terms of feedback:

Good introduction into agile concept and MVP. Extremely engaging and persuasive games to demonstrate concept! Lots of fun!

All of it was brilliant and also further reading is great to have

This was a great module and something I want to take further. This was the first time I heard of agile and Dan broke down exactly what it was in bite size pieces which was really helpful.

So much fun and energy created through very simple activities. It all made sense — easily relatable slides. Thought Marie did a great job

Really practical and useful to focus on the mindset not the methodology, which I think is more applicable to this role

I’ve heard the term agile a lot in relation to my clients so was really useful to understand this broken down in a really basic and understandable way and with exercises. This has led me to really understand the principles more than through reading I’ve done.

Very interesting topic, great presentation slides, games, engaging presenter

Very engaging and interesting session. Particularly liked the games and the story boarding.

Very engaging and impactful session. The activities really helped drive home the concepts in an accessible way

Best.Session.Ever.

Thanks to Andy, Marie, Stefano, James and Dan for running sessions, as well as Mark M, Paul, Bev, Ashley, Tim, Anna, Mark P, Gurdeep and Brian for their assistance with running the exercises.

Next Week

Next week I’ll be heading out to Dubai to our Middle East office to run a couple training sessions for teams out there. A welcome break from the cold British weather — looking forward to meeting new faces and starting their Agile journey as well as catching up with those who I trained last time!

Weeknotes #33

Right to Left

This week I finished reading Mike Burrows’ latest book Right to Left

Yet again Mike manages to expertly tie together numerous aspects of Agile, Lean and everything else, in a manner that’s easy to digest and understandable from a reader/practitioner perspective. One of my favourite sections of the book is the concept of the ‘Outside-In’ Service Delivery Review. As you can imagine from the title of the book, it’s taking the perspective of the right (needs, outcomes, etc.) as an input, over the left (roles, events, etc.) and then applying this thinking across the board, say for example in the Service Delivery Review meeting. This is really handy for where we are on our own journey, as we emphasise the need to focus on outcomes in grouping and moving to product teams that provide a service to the organisation. One area of this being around how you construct the agenda of a service review. 

I’ve slightly tweaked Mikes take on matters, but most of the format/wording is still the same:

With a Service Review coming soon, the hope is that we can start adopting this format as a loose agenda going forward, in particular due to it’s right to left perspective.

Formulating the above has also helped with clarity around the different events and cadences we want teams to be thinking about in choosing their own ways of working. I’ve always been a fan of the kanban cadences and their inputs/outputs into each other:

However I wanted to tweak this again to be a bit simpler, to be relevant to more teams and to align with some of what teams are already doing currently. Sonya Siderova has a nice addition to the above with some overarching themes for each meeting, which again I’ve tailored based on our context:

These will obviously vary depending on what level (team/service) we’re focusing on, but my hope is something like the image above will give teams a bit clearer steer as to things they should be thinking about and the intended purpose of them.

Digital Accelerators

We had another session for our Digital Accelerators this week, which seemed to be very well received by our attendees. We did make a couple changes for this one based on the feedback from last week, removing 2–3 slides and changing the Bad Breath MVP exercise from 2 groups to 4 groups. 

It’s amazing how much a little tweak can make, as it did feel like it flowed a lot easier this time, with plenty opportunity for people to ask questions. 

Last weeks session was apparently one of the highest scoring ones across the whole week (and apparently received the biggest cheer when the recap video showed photos of people playing the ball point game!), with a feedback score of 4.38/5 — hopefully these small changes lead to an even higher score once we get the feedback!

Next Week

Next week is a quieter one, with a trip to Manchester on Tuesday to meet Dave, our new DevOps Engineer, as well as help coach one of our teams around ‘Product’ thinking with one of our larger IT projects at the minute. Looking forward to some different types of challenges there, and how we can start growing that product management capability.

Weeknotes #32

Little Bets

A few weeks ago, I was chatting to a colleague in our Robotic Process Automation (RPA) team who was telling me about how the team had moved to working in two-week sprints. They mentioned how they were finding it hard to keep momentum and energy up, in particular towards the end of the sprint when it came to getting input to the retro. I asked what day of the week they were starting the sprint to which they replied “Monday”, of course meaning the sprint finished on a Friday. A suggestion I had was actually to move the start of the sprint (keeping the two-week cadence) to be on a Wednesday, as no one really wants to be reviewing or thinking about how to get better (introspection being a notoriously tougher ask anyway) on a Friday. They said they were going to take it away and run it as an experiment and let me know how it went. This week the team had their respective review and retrospective, with the feedback being that the team much preferred this approach, as well as the inputs to the retro being much more meaningful and collaborative.

It reminded me that sometimes as coaches we need to recognise that we can actually achieve big through small, and that a tiny little tweak can actually make the world of difference to a team. For myself I’ve recently found that I’ve been getting very frustrated with bigger changes we want to make, and concepts not landing with people, despite repeated attempts at engagement and involvement. Actually, sometimes it’s better to focus on those tiny tweaks/experiments that can make a big difference.

This concept is explained really well in Peter Sims “Little Bets”, a great book on innovation in organisations through making series of little bets, learning critical information from lots of little failures and from small but significant wins.

Here’s to more little bets with teams, rather than big changes!

Digital Accelerators

This week we also ran the first of two sessions introducing Agile to individuals taking part in our Digital Accelerator programme at PwC. The programme is one of the largest investments by the firm, centered on upskilling our people on all things digital, covering everything from cleansing data and blockchain to 3D Printing and drones.

Our slot was 90 minutes long, where we introduced the manifesto and “Agile Mindset” to individuals, including a couple of exercises such as the Ball Point Game and Bad Breath MVP. With 160 people there we had to run 4 concurrent sessions with 40 people in each, which was the smallest group size we were allowed!

I thoroughly enjoyed my session, as it had been a while since I’d done a short, taster session on Agile — good to brush off the cobwebs! The energy in the room was great, with some maybe getting a little too competitive with plastic balls!

Seems like the rest of our team also enjoyed it, as well as the attendee feedback being very positive. We also had some additional help from colleagues co-facilitating the exercises which I’m very thankful for as it would have been chaotic without their help! Looking forward to hearing how the Digital Accelerators take this back to their day to day, and hopefully generate some future work for us with new teams to work with.

Next week

Next week is another busy one. I’m helping support a proposal around Enterprise Agility for a client, as well as having our first sprint review for our ways of working programme. On top of that we have another Digital Accelerator session to run, so a busy period for our team!

Weeknotes #31

OKRs

We started the week off getting together and formally reviewing our Objectives and Key Results (OKRs) for the last quarter, as well as setting them for this quarter.

Generally, this quarter has gone quite well when you check against our key results, with the only slight blip being around the 1-click deployment and the cycle time at portfolio level. 

A hypothesis I have is due to the misunderstanding around people feeling that they had to hold a retrospective before moving something to “done”, we have inadvertently caused cycle times to elongate. With us correcting this and again re-emphasizing the need to focus on the small batch, the goal for this quarter really will be to focus on getting that as close to our 90-day Service Level Expectation (SLE) at portfolio level. As well as this will be putting some tangible measurements around spinning up new, dedicated product teams and building out our lean offering.

Prioritisation

Prioritisation is something that is essential to success. Whether it be at strategic, portfolio, program or team level, priorities need to be set so that people have a clear sense of purpose, have a goal to work towards, have focus and that ultimately we’re working on the right things. Prioritisation is also a very difficult job, too often we rely on HiPPO (Highest Paid Person's Opinion), First In, First Out (FIFO) or just sheer gut feel. In previous years, I provided teams with this rough, fibonacci-esque approach to formulating a ‘business value’ score, then dividing this by effort to get an ‘ROI’ number:

Business Value Score

10 — Make current users happier

20 — Delight existing users/customers

30 — Upsell opportunity to existing users/customers

50 — Attract new business (users, customers, etc.)

80 — Fulfill a promise to a key user/customer

130 — Aligns with PwC corporate/strategic initiative(s)

210 — Regulatory/Compliance (we will go to jail if we don’t do it)

It’s fairly “meh” I feel, but was a proposed stop gap between getting them doing nothing and something that used numbers. Rather bizarrely, the Delight existing users/customers aspect was then changed by people to be User has agreed deliverable date — which always irked me, mainly as I cannot see how this has anything to do with value. Sure people may have a date in mind, but this to do with urgency, not value. Unfortunately a date-driven (not data-driven) culture is still very prevalent. Just this week for example we had someone explain how an option was ‘high priority’ as it was to going to be delivered in the next three months(!).

Increasingly, I’m finding a simple, lightweight approach to prioritisation I’m gravitating towards, and one that is likely to get easier buy in, is Qualitative Cost of Delay.

Source: Black Swan Farming — Qualitative Cost of Delay

Cost of Delay allows us to combine value AND urgency, which is something we’re all not very good at. Ideally, this would be quantified so we would all be talking a common language (i.e. not some weird dark voodoo such as T-Shirt sizing, story points or fibonacci), however you tend to find people fear numbers. My hope is that this way we can get some of the benefits of cost of delay, whilst planting the seed of gradually moving to more of a quantified approach.

Next Week

Next week is a big week for our team. We’re running the first of two Agile Introduction sessions as part of the firms Digital Accelerator program. With four sessions running in parallel with roughly 40 attendees in each, we’ll be training 160 people in a 90-minute session. Looking forward to it but also nervous!

Weeknotes #30

CI/CD

We started the week with Jon running a demo for the rest of UKIT on CI/CD, with a basic website he built using Azure DevOps for the board, pipeline, code and automated testing. I really enjoyed the way it was pitched, as it went into just enough detail for people who like the technical side, but also was played out in a ‘real’ way of a team pulling an item from the backlog, deploying a fix and being able to quickly validate that the fix worked whilst not compromising on quality and/or security. This was a key item for our backlog this quarter, as it ties in nicely to one of our objectives around embedding Agile delivery in our portfolio, specifically around the technical excellence needed. We’re hoping this should start to spark curiosity and encourage others to start exploring this with their own teams — even if not fully going down the CI/CD route, the pursuit of technical excellence is something all teams should be aspiring to achieve.

Aligned Autonomy

This week we’ve been having multiple discussions around the different initiatives that are going on in our function around new ways of working. Along with moving to an Agile/Product Delivery Model, there are lots of other conversations taking place around things such as changing our funding model, assessing suppliers, future roles, future of operations and the next generation cloud, to name a few. With so many things going on in parallel, it’s little surprise that overlap happens, blockers quickly emerge, and/or a lack of shared understanding ceases to exist. Henrik Kniberg has a great talk where he talks about the importance of aligned autonomy, precisely the thing that we’re missing currently.

Thankfully, those of us involved in these various initiatives have come together to highlight the lack of alignment, with the aim of something a bit more cohesive to manage overlap and dependencies. A one day workshop is planned to build some of this out and agree priorities (note: 15 different ‘priorities’ is not prioritisation!) — which should provide a lot more clarity. 

An important learning though has to be around aligned autonomy, making sure any sort of large ways of working initiative has this.

Next Week

Next week has a break midweek for me, as I have a day off for my birthday 😀 We’ll have a new DevOps Engineer — Dave starting on Monday, looking forward to having him join our organisation and drive some of those changes around the technical aspects. Dan is running a lunch and learn for the team on LeSS, which will be good to hear about his learnings from the course. We’ve also got an OKR review on Monday which will be good to assess how we’ve done against our desired outcomes and what we need to focus on for next quarter.