The first in a three-part series on moving away from Story Points and how to introduce empirical methods within your team(s).
Part one refamiliarises ourselves with what story points are, a brief history lesson and facts about them, the pitfalls of using them and how we can use alternative methods for single item estimation.
What are story points?
Story points are a unit of measure for expressing an estimate of the overall effort (or some may say, complexity) that will be required to fully implement a product backlog item (PBI), user story or any other piece of work.
When we estimate with story points, we assign a point value to each item. Typically, teams will use a Fibonacci or Fibonacci-esque scale of 1,2,3,5,8,13,21, etc. Teams will often roll these points up as a means of measuring velocity (the sum of points for items completed that iteration) and/or planning using capacity (the number of points we can fit in an iteration).
Why do we use them?

There are many reasons why story points seem like a good idea:
The relative approach takes away the ‘date commitment’ aspect
It is quicker (and cheaper) than traditional estimation
It encourages collaboration and cross-functional behaviour
You cannot use them to compare teams — thus you should be unable to use ‘velocity’ as a weapon
A brief history lesson
Some things you might not know about story points:

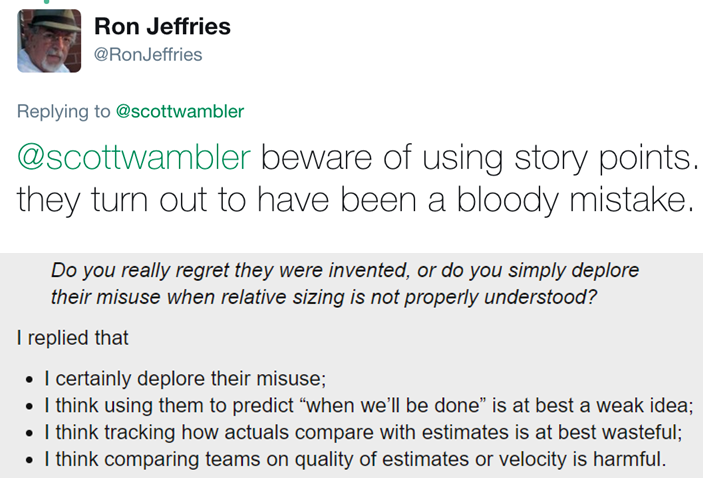
Ron’s current thoughts on the topic
Story points are not (and never have been) mentioned in the Scrum Guide or viewed as mandatory as a part of Scrum
Story points originated from eXtreme Programming (XP)
- Chrysler Comprehensive Compensation (C3) project was the birth of XP
- They originally estimated in “ideal days” and later, unitless Story Points
- Ron Jeffries is credited with being the person who introduced them
James Grenning invented Planning Poker which was first publicised in Mike Cohn’s book Agile Estimating and Planning
Mountain Goat Software (Mike Cohn) own the trademark on planning poker cards and the copyright on the number sequence used for story point estimation
Problems with story points

What time would you tell your
friends you’d meet them?
They do not speak in the language of our customer
Telling our customers and stakeholders something is a “2” or a “3” does not help when it comes to new ways of working. What if we did this in other industries — what would you think as a customer? Would you be happy?
They may encourage the right behaviours, but also the wrong ones too
Agileis all about collaboration, iterative execution, customer value, and experimentation. Teams can have ‘high velocity’ but be finishing everything on the last day of the sprint (not working at a sustainable pace/mini waterfalls) and/or be delivering the wrong things (build the wrong thing). Similarly, teams are pressured to ‘increase velocity’ which is easy to artificially inflate by making every 2 into a 3, 3 into a 5, etc. — then we have increased our velocity!
They are hugely inconsistent within a team
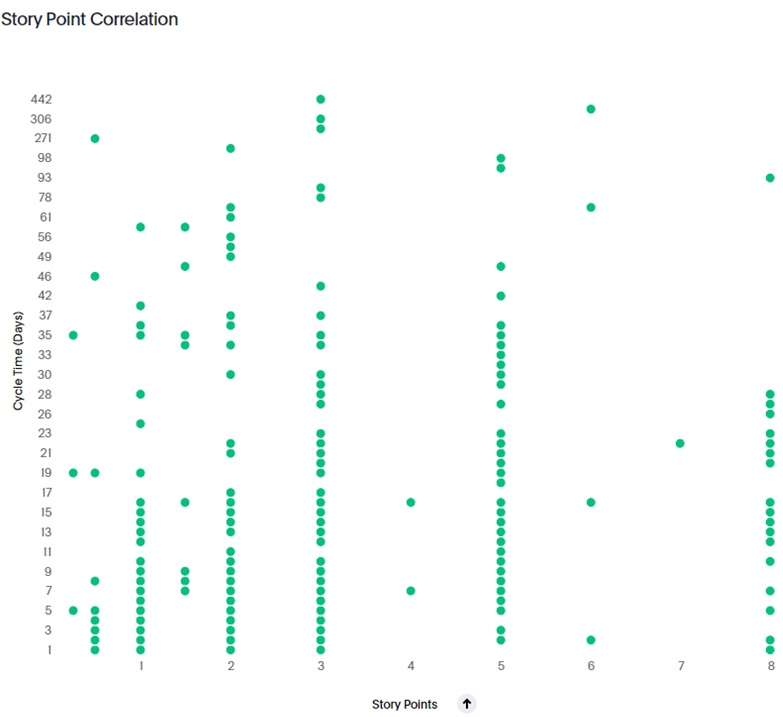
Plot the actual time from starting to finishing an item (in days) against the story point estimate. Compare the variance for stories that had the same points estimate:

For this team (in Nationwide) we can see:
1 point story — 1–59 days
2 point story — 1–128 days
3 point story — 1–442 days
5 point story — 2–98 days
8 point story — 1–93 days

They are a poor mechanism for planning / full of assumptions
Not only is velocity a highly volatile metric but it also encourages playing ‘Tetris’ with people in complex work. When estimating stories, teams purely take the story and acceptance criteria as written. They do not account for various assumptions (customer availability, platform reliability) and/or things that can go wrong or distract them (what is our WIP, discovery, refinement, production issues, bug-fixes, etc.) during an iteration.
Uncovering better ways

Agile has always been about “uncovering better ways”, after all it’s the first line of the Manifesto!
Given the limitations with story points, we should be open to exploring alternative approaches. When looking at uncovering new approaches, we need to be able to:
Forecast/Estimate a single item (PBI/User Story)
Forecast/Estimate our capacity at a sprint level (Sprint Backlog)
Forecast/Estimate our capacity at a release level (Release Backlog)

Source: Jon Smart — Sooner, Safer, Happier
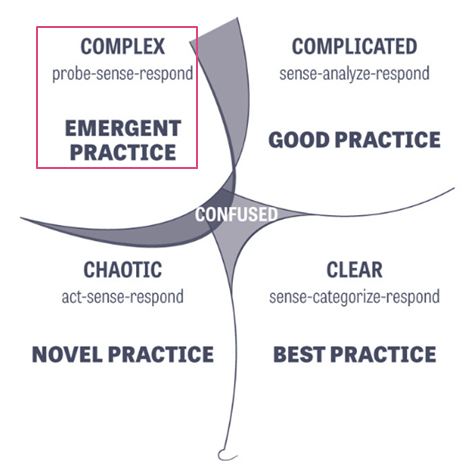
Estimating when something will be done is particularly tricky in the world of software development. Our work predominantly sits in the domain of ‘Complex’ (using Cynefin) where there are “unknown unknowns”. Therefore, when someone asks, “when will it be done?” or “what will we get?” — we cannot estimate give them a single date/number, as there are many factors to consider. As a result, you need to approach the question as one which is probabilistic (a range of possibilities) rather than deterministic (a single possibility).
Forecasts are about predicting the future, but we all know the future is uncertain. Uncertainty manifests itself as a multitude of possible outcomes for a given future event, which is what science calls probability.
To think probabilistically means to acknowledge that there is more than one possible future outcome which, for our context, this means using ranges, not absolutes.
Single item forecast/estimation
One of the two key flow metrics that inputs into single item estimation is our Cycle Time. Cycle time is the amount of elapsed time between when a work item started and when a work item finished. We visualise this on a scatter plot, like so:

On the scatter plot, each ‘dot’ represents a PBI/user story, plotted against the completion date and the time (in days) it took to complete. Our 85th percentile (highlighted in the visual) tells us that 85% of our stories are completed within n days or less. Therefore with this team, we can say that 85% of the time we finish stories in 26 days or less.
We can communicate this to customers and stakeholders by saying that:
“If we start work on this today, there is an 85% chance it will be done in 26 days or less”
This may be sufficient for your customer (if so — great!), however they may push for it sooner. If, for instance, with this team they wanted the story in 7 days, you can show them (with data) that this is only 50% likely. Use this as a basis to start the conversation with them (and the rest of the team!) around breaking work down.
What about when work commences?
If they are happy with the forecast, and we start work on an item, it’s important that we don’t stop there and ensure we continue to manage the expectations of the customer.
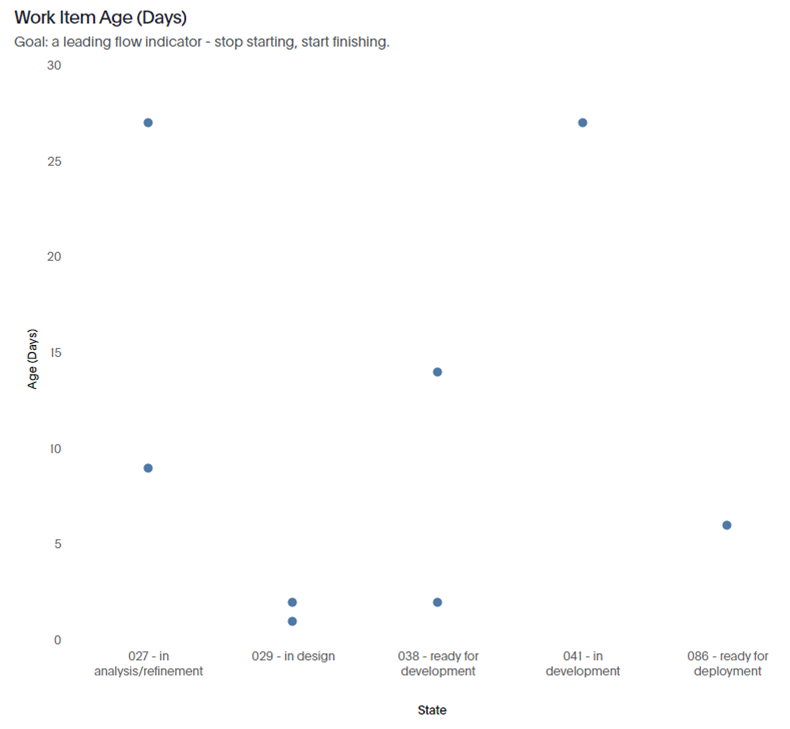
Work Item Age is the second metric to use to maintain a continued focus on flow. This is the amount of time (in days) between when a item started and the current time. This applies only to items that are still in progress.

Each dot represents a user story and the age (in days) of that respective PBI/user story so far.
Use this in the Daily Scrum to track the age of an item against your 85th percentile time, as well as comparing to where an item is in your process.
If it is in danger of ‘breaching’ the cycle time, swarm on an item or break it down accordingly. If this can’t be done, work with your stakeholder(s) to collaborate on how to achieve the best outcome.
As a Scrum Master / Agile Delivery Manager / Coach, your role would be to guide the team in understanding the trade offs of high WIP age items vs. those closest to done vs. starting something new — no easy task!

Summary — Single Item Forecasting
In terms of a story pointless approach to estimating a single item, try the following:
Prioritise your backlog
Use your Cycle Time scatter plot and 85th percentile
Take the next highest priority item on your backlog
As a team, ask — “Do we think this can be delivered within our 85th percentile?”
(Note: you can probe further and ask ‘can this be delivered within our 50th percentile?” to promote further slicing/refinement)
If yes, then let’s get started/move it to ‘Ready’
(considering your work-in-progress)
If no, then find out why/break it down till it is small enough
Once we start work on items, use Work Item Age as a leading indicator for flow
Manage Work Item Age as part of your Daily Scrum, if it looks like it may exceed the 85th percentile — swarm/slice!
Please note: it’s best to familiarise yourself with what your 85th percentile is first (particularly in comparison to your cadence).
If it’s 100+ days then you should be focusing initially on reducing that time — this can be done through various means such as pairing, mobbing, story mapping, story slicing, lowering WIP, etc.
But what about for multiple items? And what about…
For multiple item forecasting, be sure to check out part two.
If you have any questions, feel free to add them to the comments below in time for part three, which will cover common questions/observations people make about these new methods…
— — — — — — — — — — — — — — — — — — — — — — — — — —
References:
George Dinwiddie — Software Estimation Without Guessing: Effective Planning in an Imperfect World
Jeff Sutherland — Sprint Burndown: by hours or by story points?
Jeff Sutherland — Story Points: Why are they better than hours?
John Cutler — Stop Playing Tetris (With Teams, Sprints, Projects, and Individuals)
Troy Magennis — Story Point Velocity or Throughput Forecasting — Does it matter?
